

I’m skeptical every time I hear someone use the word ‘average’, because averages tend to be used only when they skew data in people’s favor. Politicians talk about the increase in ‘average’ incomes and investment managers talk about ‘average’ returns.
When you hear that average incomes are increasing, you are led to believe that this increase is enjoyed by all. But what if the increase is only due to the fact that a few millionaires became billionaires and everyone else stayed the same? The problem with using this metric is that outliers skew the data and no one really falls into the ‘average’ category, and there are generally more accurate ways to present data. In the world of investing, averages are practically useless.
For example, if the stock market averaged 5% over the last five years, what does that mean? The table below illustrates this point by showing three examples of five-year returns that all equate to an average of 5%.
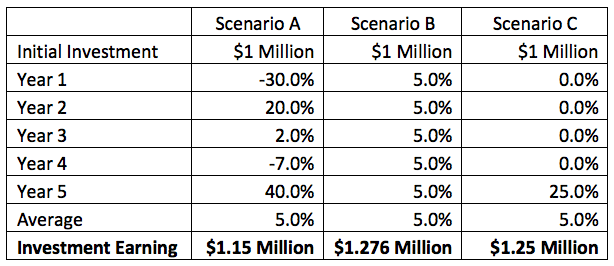
In the above example, the five-year average is the same, but the dollars generated from each scenario are not. A $1 million investment earning the returns under scenario A would be worth $1.15 million after five years, while the investment in scenario B would be worth $1.276 million. Lastly, scenario C would generate $1.25 million. As you can see, the same average return doesn’t produce the same results.
This arithmetic average is the method by which the above example was computed. This is the method we learned in grade school and is the most common way of computing averages. You simply add up the numbers and then divide it by the number of inputs. The formula is as follows:
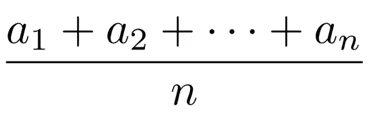
a=portfolio return
n=number of time periods
The challenge with this method in the investment world is that a stock that declines 20% one year and then gains 20% the next year is still not back to even. For example, if a $1 million investment lost 20% it would be worth $800,000. If that $800,000 gained 20%, it would be worth $960,000, or $40,000 less than that what you originally started with. In order to get back to even, that $800,000 would have to gain 25%.
The table below shows the equivalent gain for an investment to get back to even using the arithmetic average concept.
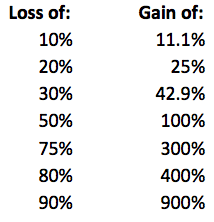
An investment that loses 50% requires a 100% gain to get back to even. This is inherently the problem with using an arithmetic average. The bigger the loss, the larger the gain required on the other side. This is also the reason why portfolio losses need to be minimized. An investment that loses 75% has virtually no chance of seeing the light of day. Generating a 5% average return on a consistent basis is far more profitable than earning a 5% average return with tremendous volatility.
The more accurate average to use when computing investment returns is the geometric average. Here’s how it works:

x=portfolio return+1
n=The number of time periods
Calculating the geometric average from scenario A above would look like this:
((1-.3)*(1+.2)*(1+.02)*(1-.07)*(1+.4))^(1/5)-1
In this case, the geometric average is only 2.21%, which happens to also equate to the annualized average return equivalent. In other words, a $1 million investment that earns 2.2% per year will generate the same return. The geometric return for scenario B above is exactly 5% and is 4.56% for scenario C. Geometric return is most useful over longer time periods where compounding comes into play and volatility greatly enhances the difference between geometric and arithmetic averages. From 2000 to 2017 the geometric average of the stock market was 4.51%, whereas the arithmetic average was 6.16%.
When people quote large data sets of information unrelated to investment returns, the median is a more useful metric because it calculates the middle point of the data and doesn’t let outliers skew the results. For example, in the data set of ten numbers below, the average income is $88,500, but the median is only $40,000.
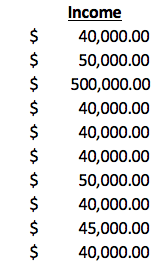
The median is also a useful term to understand because the marketing materials for private investment opportunities are often filled with demographics and income trend information. Plus, say the above data set represents the income of residents in an apartment complex where the business plan calls for raising rents. Looking at renter income, it might seem realistic to raise rents by $100 per month on a tenant base earning an average of close to $100,000 per year. However, if you look at the median, you see the reality is that the majority of the tenants are earning around $40,000 and will be much more sensitive to a $100 monthly increase in their rent.
Be skeptical and inquisitive when you hear or see the word ‘average.’ Understanding the limitations of averages is key to evaluating certain investments and separating fact from fiction. Next time someone quotes an ‘average,’ inquire as to which type of average they are using and also ask about the median. These simple concepts are imperative to know in today’s complex investing world.


