

This article was originally published in December 2017 and previously updated in July 2024.
Quick take: A cap rate is the first-year net operating income (NOI) divided by a property’s purchase price. That’s shorthand for the income yield at acquisition and a window into risk and growth. Cap rate = NOI ÷ price. Example: $80,000 NOI on a $1,000,000 purchase = 8%. This guide explains how cap rates work, when they can be misleading, and how investors use going‑in and exit caps to value deals.
A capitalization, or “cap,” rate is the ratio of a property’s net operating income (NOI) in the first year of ownership to its purchase price. It’s a fundamental concept in commercial real estate and a practical shorthand for income yield at acquisition. Investors who understand how a cap rate works—and when to use it—gain deeper insight into potential investments.
How Does a Cap Rate Work?
Use the cap rate formula: Cap rate = NOI ÷ purchase price. For example, if a property’s first‑year NOI is $80,000, and the price is $1,000,000, the cap rate is 8%. You can also run the formula in reverse to estimate value: Price = NOI ÷ market cap rate. A $60,000 NOI at a 6% market cap rate implies a value of $1,000,000.
The capitalization rate is a useful starting point. But it’s a one‑year snapshot and doesn’t capture growth, capital costs or risk (we’ll address those below).
Why does the cap rate formula work to value properties? Because a cap rate is essentially the no‑growth version of a discounted cash flow (DCF). It’s nearly identical to the finance formula for valuing a perpetuity (an income stream that continues indefinitely). Here’s the formula:
Perpetuity Value = Annual Income / Expected Rate of Return
This is the same idea behind cap rates: With no NOI growth, price ≈ NOI ÷ cap rate (the cap rate reflects the investor’s required return).
To find the value of a perpetuity, take the annual income and divide it by the expected return. For example, if an investor expects a 4% return on a $1,000 annual income stream, they’d pay $25,000 ($1,000 ÷ 0.04). The equation can be reversed to determine the implied or expected return at a given price: Expected return = income ÷ price. If the perpetuity is priced at $30,000, the expected return is 3.33% ($1,000 ÷ $30,000).
How to Value a Property with Cap Rate: Price = NOI ÷ Cap Rate
Valuing a property using a cap rate works the same way. In theory, if property cash flows continue indefinitely, you can treat NOI as the annual income (numerator) and the cap rate as the required return (denominator). Example: If a property is expected to produce $25,000 of NOI each year and market cap rates are 8%, then the property would be valued at $312,500 ($25,000 divided by 0.08).
Cap rates are a simplified snapshot, because in practice, real estate has changing cash flows and physical risks. Conceptually, cap rates blend two drivers: the investor’s expected or required return and the expected growth rate of income. A common way to express this is:
Capitalization Rate = Expected Returns – Growth Rate of Income
Expected Return: Definition, Drivers and Examples
The expected return, also called the required rate of return, is the annual return an investor expects to earn over the hold period of an investment. Riskier cash flows require a higher expected return because their income is more volatile and uncertain. That’s why stocks typically target higher expected returns than bonds. And it’s why an investor in a ground-up development apartment complex would expect to generate a higher return than an investor in a stabilized apartment complex.
Expected returns change over time with available alternatives and the 10-year Treasury, or risk‑free rate. A useful shortcut is: Expected return ≈ risk‑free rate (10‑year Treasury) + risk premium. If a 10‑year Treasury yields 4%, investors will require more than 4% for riskier assets.
How Changes in Expected Return Affect Value and Cap Rates
Let’s build on the perpetuity example above. If the required rate of return rises to 5% from 4% during the hold period, the value of the perpetuity falls to $20,000 ($1,000 ÷ 0.05). With a fixed income stream, the only way to earn a higher return is to pay a lower price. Because the value has declined, the cap rate has expanded.
The reverse also holds when required rates of return decline: If the expected return declines to 3% from 4%, the value of the perpetuity increases to about $33,333 ($1,000 ÷ 0.03). Because the value has increased, the cap rate has compressed.
The cap rate is more than just the investor’s expected return. It is a combination of both the expected return and the future growth of NOI, as real estate cash flows tend to increase over time.
NOI Growth: The Biggest Driver of Cap Rates and Value
Net operating income (NOI) growth is one of the biggest advantages of owning real estate. Lease rates typically increase over time, providing owners with a growing income stream. Contractual rent growth, written into leases, often runs about 1% to 3% annually. Market rent growth can swing from about -5% to 10% year to year. But in markets with strong jobs and population growth, it often averages 2% to 4%, or even more. Market rent growth is measured by comparing rents on newly signed leases year over year.
Growth of NOI is a critical input when considering cap rates and value. And even small changes in growth assumptions can materially change the property’s price. Here, “growth” means expected future income growth; past growth matters mainly because it shapes expectations about the future.
Here is the formula to value a growing perpetuity:
Perpetuity Value = Annual Dividend / (Expected Rate of Return – Future Growth Rate of NOI)
Building on the perpetuity example from above, here’s another example. Let’s say an investor requires a 4% return annually, and the $1,000 income stream is expected to grow 2% per year. The investor would now be willing to pay $50,000 for that same $1,000 perpetuity because of the annual 2% growth rate in the income stream. That’s $1,000 ÷ (0.04 – 0.02). A 2% growth rate doubles the price versus a no‑growth case, even though year‑one income is identical.
Why Real Estate Appreciates: NOI Growth Over the Hold
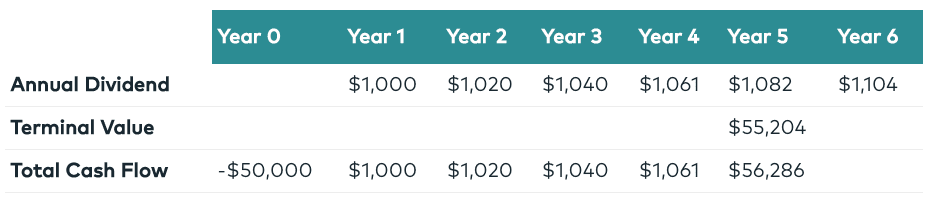
Most investors don’t hold properties forever; total return comes from ongoing cash flow plus price appreciation. Real estate tends to appreciate when the property’s NOI is higher at sale than at purchase—a larger income stream supports a higher exit value at the prevailing exit cap rate. The five‑year example below shows how steady NOI growth drives both interim cash distributions and a higher terminal value at sale.
| Year 0 | Year 1 | Year 2 | Year 3 | Year 4 | Year 5 | Year 6 | |
|---|---|---|---|---|---|---|---|
| Annual Dividend | $1,000 | $1,020 | $1,040 | $1,061 | $1,082 | $1,104 | |
| Terminal Value | $55,204 | ||||||
| Total Cash Flow | -$50,000 | $1,000 | $1,020 | $1,040 | $1,061 | $56,286 |
In this example, the investor pays $50,000 and sells after five years. The exit value of the perpetuity—the value of the perpetuity when it sells—of $55,204 is calculated by taking the year six cash flow and dividing it by the 4% expected rate of return, minus the 2% future growth rate of NOI. The formula: $1,104 ÷ (0.04 minus 0.02).
How Expected Return and NOI Growth Determine Cap Rate—and Your Return Mix
A cap rate blends two inputs: the investor’s required or expected return and the expected growth rate of NOI. This is why a property with an 11% cap rate and -3% expected NOI growth can deliver the same modeled return as a 5% cap rate property with 3% growth.
11% cap rate: $25,000 / (0.08+0.03) = $227,272
5% cap rate: $25,000 / (0.08-0.03) = $500,000
In both cases, investors target an 8% total return, but the path differs: The 11% cap deal delivers more current cash flow with likely principal erosion. But the 5% cap deal offers lower current yield but expects appreciation as NOI grows.
Cap Rate Compression vs. Expansion: How Market Cycles Move Values
Real estate cycles often reflect shifts in three things: The investor’s required or expected returns, expectations for NOI growth, and actual NOI. When growth looks strong and capital is plentiful, cap rate compression can occur—NOI rises (larger numerator) while cap rates fall (smaller denominator), pushing values higher.
When the economy slows, NOI can decline, and buyers reduce growth assumptions. That results in a smaller numerator and larger denominator in the valuation formula. At the same time, required returns rise as risk premiums widen and liquidity tightens. The result is cap rate expansion—higher cap rates and lower values. After the 2008 recession, elevated credit risk and weak growth expectations led to wider cap rates and depressed NOI, driving values down. For disciplined buyers, that reset created attractive entry points. And in the following years, growth recovered and risk premiums narrowed.
Factors That Affect Cap Rates: Lease Term, Replacement Cost, Location
Cap rates move with real operating risk. Here are some factors:
- Longer lease duration and staggered rollover generally support lower cap rates because steadier cash flows behave more like a long‑term bond.
- Strong tenant credit has the same effect. But weaker credit widens perceived risk and pushes cap rates higher.
- Replacement cost matters: Properties priced at or below replacement cost in supply‑constrained submarkets often trade at lower cap rates, while assets far above replacement cost—or in markets where new supply is easy—tend to require higher cap rates.
- Location amplifies these dynamics: Markets with durable job and population growth, as well as clearer regulatory frameworks, usually see cap rate compression. Soft demand or heavy new supply drives expansion.
- Rent is another lever: Assets with below‑market rents can justify lower cap rates because buyers expect rents to reprice upward at renewal; above‑market rents often mean higher cap rates due to reversion risk.
Remember, cap rates work best for stabilized income. When cash flows are volatile, a 15% cap can be misleading. A lower‑income, higher‑vacancy asset may offer more upside once stabilized.
How to Mitigate Cap Rate Risk: Grow NOI and Underwrite a Higher Exit Cap
No one can predict cap rates with precision. The core risk is selling into a higher exit cap rate than you bought. At Origin Investments, we address this in two ways:
- First, we focus on value creation—operational improvements, renovations and revenue management—to grow NOI meaningfully during the hold.
- Second, we maintain exit discipline by “drifting” the underwritten exit cap rate higher over time to reflect uncertainty and asset aging.
For example, if stabilized market cap rates are about 5% today, we may model a 5.5% to 6.0% exit cap for a multi‑year hold when calculating terminal value. Beware of any real estate investments that calculate terminal value using cap rates at or below today’s rates. We also stress‑test scenarios around exit cap, rent growth and vacancy, and align leverage and debt terms with the business plan to avoid forced sales.
We go beyond cap rates to make better investment decisions. We do discounted cash flow analysis and sensitivity testing, and we study market fundamentals to make better buy/sell decisions.
FAQs: CAP Rates in Real Estate Investing
What is a cap rate and how do you calculate it?
Cap rate is first-year net operating income (NOI) divided by purchase price: Cap Rate = NOI ÷ Price. Example: $80,000 NOI on a $1,000,000 price = 8%.
What is a “good” cap rate for multifamily?
It depends on the market, asset quality, business plan and financing conditions. Investors often benchmark to the 10‑year Treasury “risk‑free” rate and local NOI growth. Lower cap rates can be acceptable if growth and risk support the total return.
How do interest rates affect cap rates?
When risk‑free rates (e.g., 10‑year Treasuries) and risk premiums rise, required returns increase and cap rates tend to expand (values down). When they fall, cap rates often compress (values up), moderated by growth expectations and capital availability.
What’s the difference between going‑in cap rate and exit cap rate?
Going‑in cap rate uses in‑place or first‑year stabilized NOI at purchase. Exit cap rate is an underwriting assumption used to estimate terminal value at sale; prudent models “drift” exit caps higher to reflect uncertainty and asset aging.
Key Takeaways
- Cap rate is a one‑year income yield: Cap Rate = NOI ÷ Price
- With no growth, price ≈ NOI ÷ cap rate; with growth, Value = NOI ÷ (Required Return − NOI Growth)
- Cap rate reflects both required or expected return and expected NOI growth.
- Cap rate compression (down) plus rising NOI pushes values up; expansion (up) and falling NOI push values down.
- Factors that shift cap rates: lease term and rollover, tenant credit, replacement cost and barriers to entry, market and location, and rent position versus the market.
- Cap rates work best for stabilized income. They can be misleading when cash flows are volatile.


