

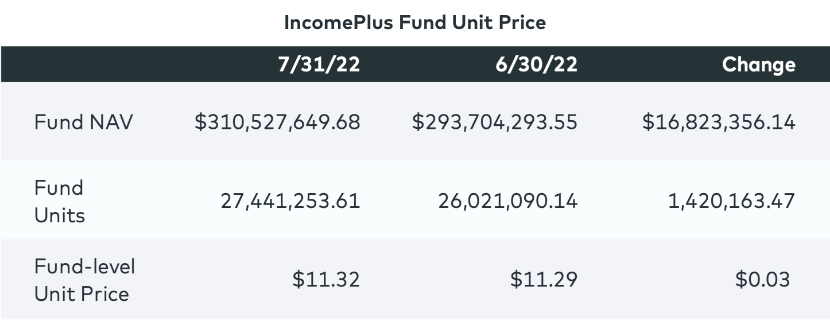
Investors entering Origin’s open-ended IncomePlus Fund acquire Fund units at a price based on the fair market value of the underlying assets. Fair market value is determined by a valuation process that has been approved by our auditors and adheres to industry best practices. This is the price at which investors enter and leave the Fund and what wealth managers use when updating the value of their clients’ portfolios.
The unit price is calculated by dividing the Fund’s net asset valuation (NAV) by the number of units in the Fund. The NAV represents the value of the Fund if it were liquidated today and includes all assets net of liabilities. The unit count changes monthly as new capital and new investors enter the Fund, the distribution yield is re-invested, and current investors increase their capital commitments.
As new capital comes into the Fund each month, the number of units increases along with the Fund’s cash balance; new capital does not impact the unit price. The key to an accurate unit price is ensuring that the NAV of the Fund’s investments is accurate. The table below shows the reconciliation completed by our accounting team to arrive at an accurate NAV from June 30 to July 31, 2022.
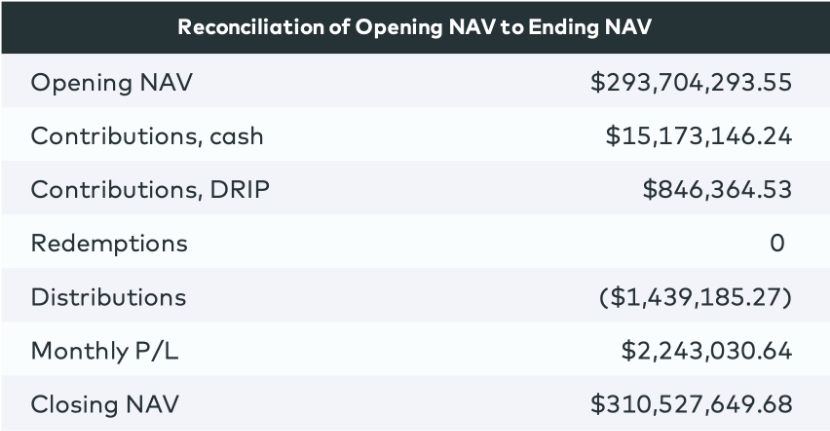
Here’s what each row in the chart above represents:
- Cash contributions: New capital coming into the Fund for the month
- DRIP contributions: Money remaining in the Fund from investors who elect to forgo the monthly distribution
- Redemptions: Investor money exiting the Fund
- Distributions: Distribution yield paid to investors
- Monthly P/L: Profit and loss; includes gains and losses on our investments along with Fund expenses
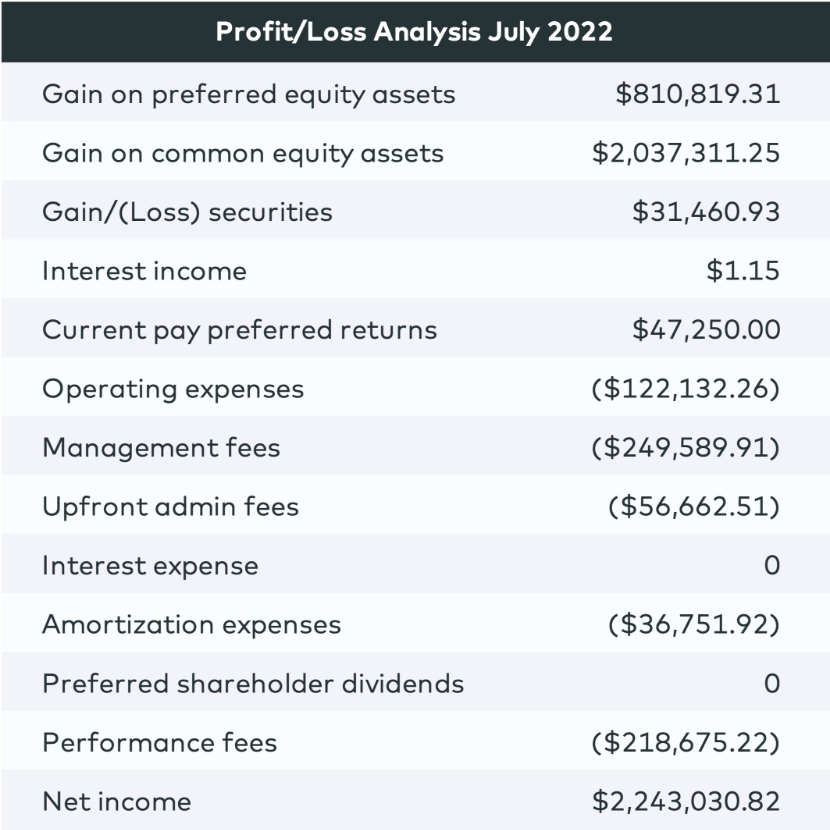
Monthly P/L is one of the most important elements in determining the unit price. The table below shows how we arrived at that number. During this time, our investments increased in value by about $2.9 million and expenses totaled $683,000, resulting in a profit of $2.2 million. In this case, performance fees are included in the expense category because we exceeded the monthly preferred return of the Fund.
In this example, the unit price increased because the Fund’s profits exceeded the monthly distribution yield paid to investors at a rate of 0.0525 cents per unit. The distribution yield payment lowered the Fund’s assets by $1.4 million, but that is more than offset by the $2.2 million in Fund profit.
The net result is an increase of about $843,000 in the Fund’s NAV after paying the distribution yield. This translates into a 3-cent increase in the unit price (843,000/27 million units). If the Fund recorded no profit for the month, the unit price would decline because of both expenses and payment of the distribution yield. The obligation of the Fund to pay a monthly distribution yield, along with expenses, means the Fund must make 0.5% to 0.6% per month for the unit price to remain unchanged.
How We Value the IncomePlus Fund’s Underlying Assets
The final component in calculating the unit price is the valuation of our investments. Our preferred equity investments typically generate around 1% per month in yield, so a $100 million portfolio of preferred equity investments generates $1 million per month in portfolio gains.
To value our stabilized assets, we use an internal process employing a discounted cash flow model and market-comparable sales. Private real estate generally doesn’t move in value significantly from month to month unless something dramatic happens. This happened in the early months of the COVID-19 pandemic and during the recent run-up in interest rates; in both cases, comparable sales were nonexistent. Our stabilized assets also generate cash flow, which increases the Fund’s assets, and they provide depreciation, which shields the Fund’s distributions from taxes.
The ground-up developments in the IncomePlus Fund are valued using a discounted cash flow model and are marked up each month as the properties get closer to stabilization. The discount rate is higher in the early days of development because that period is the riskiest and furthest away from cash flow. As the development progresses and nears stabilization, the project’s risk decreases, and variables become more certain. The discount rate decreases as well.
If rental rates or cap rates were to change in a material way today, it would affect the future stabilized value of the asset, and we would adjust our valuation accordingly. However, it doesn’t necessarily mean that we would adjust our investment today. What would change is how much we mark up the asset in the future. For example, if we invest $10 million in a property with an expected value of $20 million in three years, we might have only marked it up to $13 million after the first year. If market conditions change and the new expected stabilized value becomes $17 million, we would adjust our model so the value of the investment increases by $4 million over the next two years.
The chart below illustrates how the projected profit at stabilization is recognized throughout the development process by utilizing this methodology.
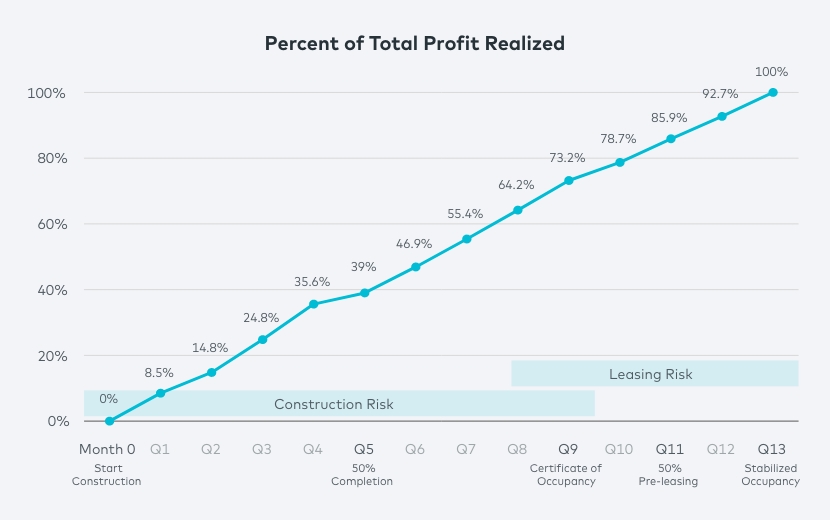
We continually monitor the market and update the valuations monthly as these projects progress. This means that new investors in the Fund will enter at a higher basis than earlier investors, but they also will be compensated for future risk in the deal.
Valuing a portfolio is part art and part science, and our goal is to provide our investors with an accurate picture of the IncomePlus Fund’s value. This monthly updating of the unit price requires constant behind-the-scenes collaboration among our accounting, investment management and investor relations teams. Together, they make this process run smoothly for thousands of investors and ensure that the investments are generating value, the Fund’s unit price is accurate, communication is timely, and money goes out on time and to the correct bank accounts.


