

This article was originally published on April 23, 2020.
Quick Take: Net asset value (NAV) in private real estate equals total asset value minus debt and capital/fixed expenses. It approximates investor equity and is driven mainly by sustained changes in NOI and capital‑market cap rates, not short‑term noise. This article walks through the formula, offers an example, and explains how investors can interpret NAV trends.
Net asset value (NAV) in private real estate is the total asset value minus outstanding debt and planned or fixed capital expenses. For investors, NAV approximates current equity and is a core lens for evaluating performance and risk. Because asset values drive realized and future returns, understanding NAV helps you interpret results and trends. While not guaranteed, with sustained operating performance and market conditions, increases in NAV can track higher distributable cash—the amount of cash available to distribute to investors.
In private real estate, NAV also signals an investment firm’s ability to create value for investors over time. It is calculated at both the asset level and the fund level. And, depending on the investment structure, it can be reported as a per‑share NAV. At Origin, for transparency and comparability, we update each asset value monthly using current market comps, rent rolls and operating expenditures.
How is NAV Calculated?
Here’s a simple example to calculate NAV in private real estate. At acquisition, an asset purchased for $50 million has a total value of $50 million. Subtract outstanding debt ($25 million) and planned capital/fixed expenses ($5 million). In this case, $50 million − $25 million − $5 million = $20 million. So, NAV is $20 million. See the table below for the line‑item breakdown.
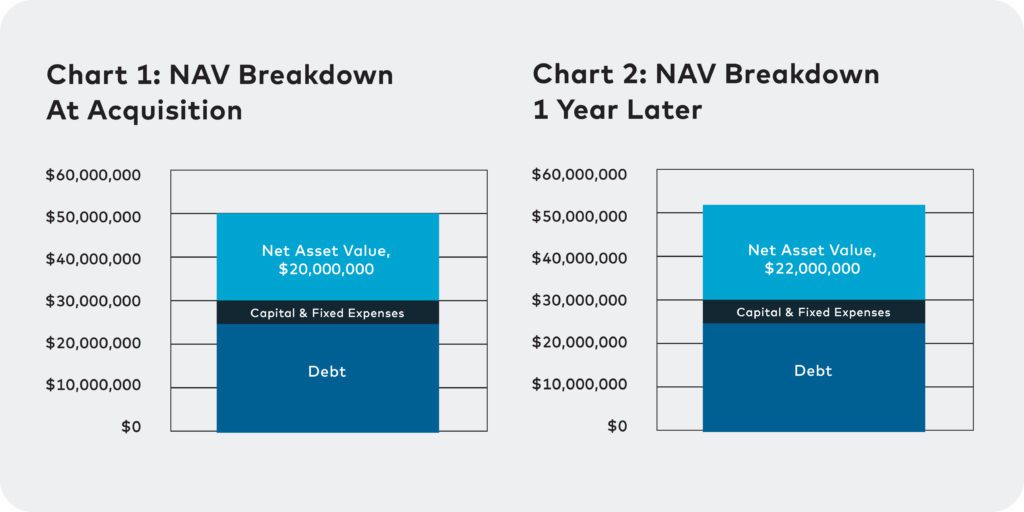
Over months and years of ownership, NAV changes. The chart below shows how it could look for an investment that has been improving operations after a year of ownership.
| | At Acquisition | 1 Year Later |
| Total Value | $50,000,000 | $52,000,000 |
| Less: Debt | ($25,000,000) | ($25,000,000) |
| Less: Capital & Fixed Expenses | ($5,000,000) | ($5,000,000) |
| Net Asset Value | $20,000,000 | $22,000,000 |
Because NAV is a function of total asset value, any change in valuation changes NAV. In private real estate, NAV typically moves for two reasons: sustained shifts in net operating income (NOI) and changes in capital markets (such as cap rates and the cost of capital).
How Net Operating Income (NOI) Affects NAV in Private Real Estate
NOI is a property’s revenue minus operating expenses. Property‑level revenue moves with supply and demand. That affects renters’ ability and willingness to pay—for example, nearby concessions signal weaker demand, while new employment hubs support stronger demand. These factors can change short‑term NOI. But NAV in private real estate only moves when the income impact is expected to persist.
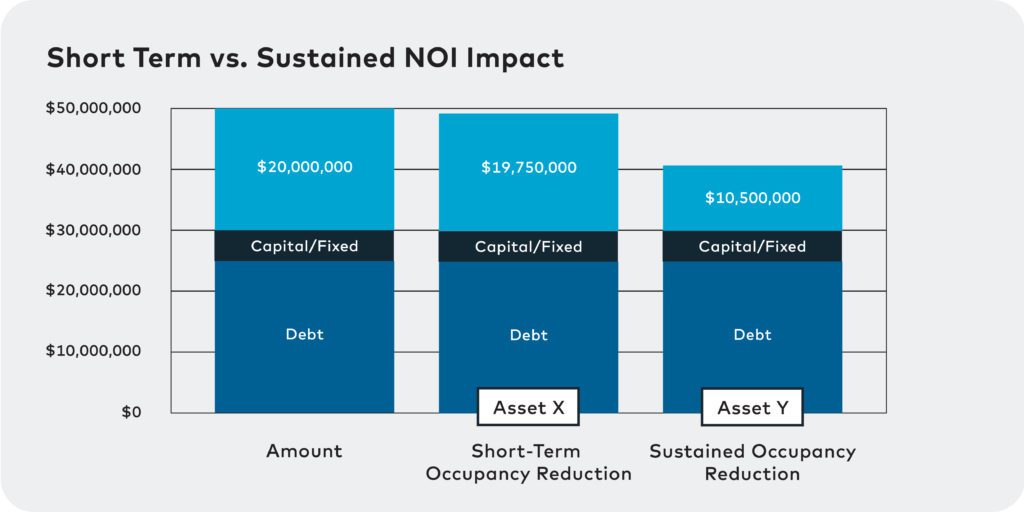
For example, consider a well‑located, Class A asset with a diverse tenant base operating below projected occupancy. Near‑term occupancy pressure may reduce income, but the asset’s fundamentals support long‑term stability. If the market believes that strength will endure, short‑term revenue or expense changes will have limited impact on NAV. This is reflected in Asset X in the chart below.
How Capital Markets and Cap Rates Affect NAV in Private Real Estate
Capital markets—the pricing and availability of debt and equity—have the greatest impact on NAV in private real estate. For most real estate investments, annual property income contributes roughly 10% to 20% of total return. The remaining 80% to 90% comes from residual value based on capped NOI. (Capped NOI is a property’s NOI divided by its cap rate; this formula offers an estimate of implied market value.) The cap rate acts as a multiplier on net operating income. Permanent shifts in demand, growth expectations, interest rates or the cost of capital change implied growth and exit cap rates. Those drive the largest moves in NAV.
Consider Asset Y in the chart below. Asset Y is a Class A multifamily property where about 20% of residents rely on a single nearby employer. At acquisition, the property’s NAV was $20 million, and it was 100% occupied. If that employer relocates a year later, demand and revenue fall in a way the market views as durable. Lower occupancy and reduced rents flow into capped NOI and can widen the cap rate, materially reducing NAV. This contrasts with Asset X, where a temporary NOI dip amid strong fundamentals has limited effect on NAV. See the chart below for short‑term vs. long‑term NOI impacts.
When NAV Changes in Private Real Estate—and Why It Can Lag Public Markets
Unlike stocks, private real estate NAVs do not react instantly to market events. Changes in rent rolls, expenses, supply and demand, interest rates, or cap rates lag as managers collect data and update valuations monthly or quarterly. NAV adjustments often trail public equities by at least a quarter and may be unaffected by equity volatility that doesn’t alter property income or required returns. This supports real estate’s role as a portfolio stabilizer—though NAVs do adjust when fundamentals or capital markets change.
NAV adjustments often trail public equities by at least a quarter and may be unaffected by equity volatility that doesn’t alter property income or required returns. For example, a tech-led stock selloff in April 2024 moved equities sharply, but private commercial real estate price indices showed minimal change in May and modest movement in multifamily shortly after. This resilience is why private real estate is recommended as a stabilizing component of portfolios for all types of investors.
For investors and RIAs, understanding a manager’s NAV calculation and reporting cadence is key to interpreting performance and projected returns. Look for consistent methodologies, timely updates and clear explanations of the drivers behind changes. (Read our article on the 10 key questions private real estate investors should ask to learn more.) Be cautious if NAVs rarely move—or continue rising—despite sustained market headwinds; that can indicate stale marks or aggressive assumptions.
Key Takeaways:
- Think of net asset value (NAV) as your current equity in the asset or fund. NAV = total asset value − debt − capital/fixed expenses.
- NAV only moves meaningfully with sustained net operating income (NOI) changes, not short-term noise. Asset quality and tenant diversification reduce sensitivity to brief dips.
- Capital markets and cap rates drive most NAV movement. Small cap-rate shifts can outweigh sizable NOI changes.
- NAVs update on a lag, often monthly or quarterly, and don’t track equity volatility. Avoid reading too much into stock-market moves that don’t change property cash flows.
- Study the fund manager’s methodology and cadence, including asset-level marks, comps and rent rolls. Make sure they explain changes clearly. Be cautious of stale or ever-rising NAVs. And use NAV trends alongside internal rate of return (IRR) and equity multiple when assessing performance.
FAQs on Net Asset Value (NAV)
What is net asset value (NAV) in private real estate?
NAV equals the fair value of assets minus liabilities and planned/fixed capital expenses. At a fund level, NAV per share divides the fund NAV by the number of shares outstanding.
How do you calculate NAV on a property?
Start with market value, subtract outstanding debt and planned/fixed capital expenditure (capex). Example: $52 million value – $25 million debt – $5 million capex = $22 million NAV.
How do cap rates affect NAV?
NAV is highly sensitive to cap rates because value = NOI ÷ cap rate. With all else equal, a higher cap rate lowers value and NAV.
How often is NAV updated?
Many private managers update monthly or quarterly; final values often rely on periodic third‑party appraisals and can lag market changes.
Why can NAV fall even if NOI is stable?
Rising cap rates or weaker long‑term growth assumptions reduce value even when current NOI hasn’t changed.
What should RIAs ask about NAV?
Methodology (market data, appraisals), frequency, governance and independence, write‑down policy and disclosure around changes.


