

‘Rescue Capital’ Demystified
Dave Welk, Managing Director of Acquisitions
The dislocation in the capital markets over the past two quarters, driven largely by the rapid expansion in interest rates and reduction of available debt capital, has created valuation and capitalization challenges for development and value-add investments. This environment is anticipated to persist over the next several quarters and likely will get worse before it gets better. With many lenders on the sidelines and continued challenges in deriving market values due to thin transaction volumes, we anticipate a number of projects with current or impending debt maturities will require additional capital to cover either cost overruns or the shortfall from refinance proceeds.
Some market participants have coined a term for this: “rescue capital.” However, depending on how it is structured, rescue capital is effectively just preferred equity or mezzanine debt that is inserted into the capital structure of a development or existing asset. Origin has been an active provider of preferred equity on new ground-up projects over the past several years, but, given the opaqueness of current market values, it is difficult to underwrite the risk/reward of investing fresh capital into an in-process development or existing asset. The primary challenge is to understand an asset’s value today and, moreover, its long-term value when the market ultimately stabilizes.
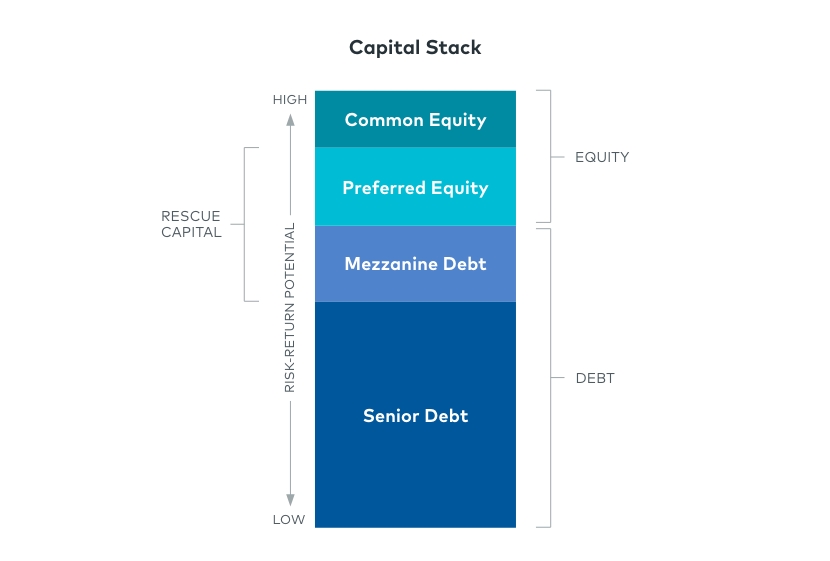
Two terms are making their way into the vernacular of capital providers when evaluating new investments into an existing deal: “attachment point” and “detachment point.” These simply refer to the debt yield at which the position starts and ends on both current and future values. As an example, let’s say a property has $50 million of senior debt and needs an additional $10 million of rescue capital to fund cost overruns and retire existing financing. If the property produces or is underwritten to produce net operating income (NOI) of $4 million, that new capital investment would “attach” at an 8% debt yield and “detach” at a 6.7% debt yield on today’s value. Using the calculation of NOI/senior debt + preferred equity:
- $4 million/$50 million = 8% (attachment point)
- $4 million/$60 million = 6.7% (detachment point)
However, the investor will make projections as to what a normalized market environment would look like, and, in evaluating adequate risk/reward, may conclude that the project’s NOI will increase in the future. Assuming it will increase by 20% to $4.8 million, the investor’s stabilized yield on their “detachment point” of the $10 million investment would increase to 8%—providing a significantly larger margin of safety than the current detachment point of 6.7%. Based on the perceived risks to achieve the underwritten increase in the NOI and the corresponding margin of safety that is created at stabilization, an investor then assigns a required rate of return that needs to be achieved on this injected capital—currently about 13% to 15%.
In a market environment where it is difficult to calculate the loan to value ratio when investing new capital into an existing capital structure, this evaluation is used along with, not in lieu of, determining where the investment sits as a percentage of replacement cost and stabilized values. With persistent choppiness in the capital markets expected over the coming 12 to 18 months, combined with a record number of multifamily units delivering in 2023 and continued restraint by senior lenders, we anticipate a significant increase in these types of “rescue capital” preferred equity investment opportunities.
Rent or Buy? Demographics Vs. Economics
Marc Turner, Managing Director of Investment Management
According to a 2022 study commissioned by the National Apartment Association and the National Multifamily Housing Council, the U.S. needs to build 4.3 million more apartments by 2035 to meet the demand for rental housing, roughly a 20% increase over the current apartment stock. In 2021, 27 million Americans moved—that’s about 8% of the population and part of the pool of about 254 million adult Americans who make housing decisions. That same year, household formation surged, driven largely by pent-up demand from millennials.
Coupled with constrained supply, rents grew by more than 25% during 2021-22, according to RealPage Market Analytics data. However, the average house payment for a newly purchased home in December 2022 was 71% more than the average monthly apartment rent, the widest delta since 2000. The own-versus-rent premium averaged only 9.7% for the five-year period ended December 2021.
Historical Gap, Monthly Homeownership Costs Vs. Renting
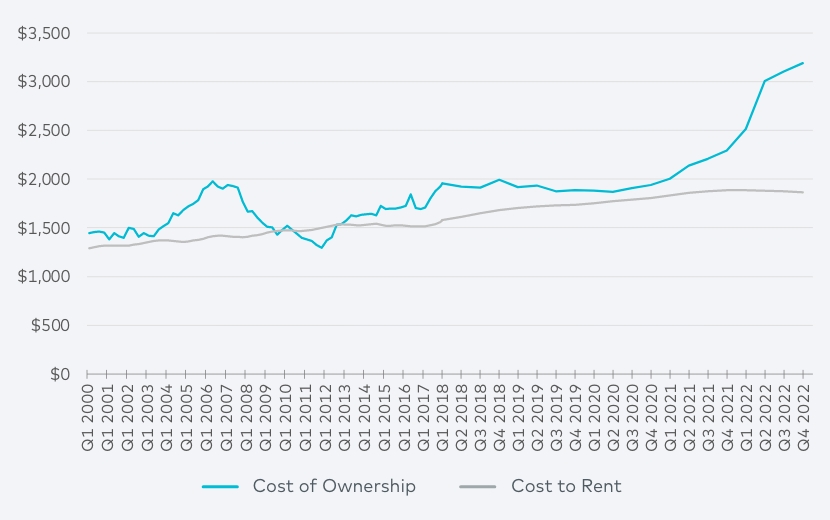
Sources: RealPage Market Analytics, Freddie Mac, Federal Reserve Bank of St. Louis, Realtor.com, Federal Housing Finance Agency, National Association of Realtors
Some details about the chart above: The monthly payment for a newly purchased home assumes a 30-year mortgage with a 10% down payment (in line with historical trends for first-time buyers from the National Association of Realtors). The median listing price is according to data from the Federal Reserve Bank of St. Louis, Realtor.com and the Federal Housing Finance Agency. Analysis assumes a private mortgage insurance payment of 0.75% and average local tax and insurance payment of 1.75% of purchase price. The average cost to rent includes historical average effective rent per RealPage Market Analytics plus $100 (renter’s insurance, parking, amenity fees).
Even though home values are falling as mortgage rates have risen, and mortgage rates are declining from recent highs, the relatively lower cost of renting should support near-term apartment demand. However, leasing traffic among prospective renters declined throughout 2022, and activity during Q4 2022 was the weakest for any Q4 since 2014. The threat of a recession has weakened consumer confidence, likely contributing to a slowdown in household formation.
According to Harvard’s Joint Center for Housing Studies (JCHS), headship rates—the share of the population heading their own households—“have recovered to rates from a decade ago, and with deteriorating affordability for both rents and homeowners over the past year, further gains in household formation may be limited.” JCHS’ analysis suggests that future household formation is likely to be driven more by population growth than increases in headship rates, and the U.S. birth rate continues to decline, which may have an impact in the long term.
Given aggressive interest rate hikes by the Federal Reserve, job growth is still healthy but slowing, despite the headline-grabbing layoff announcements by tech and finance firms, which make up only a small portion of the U.S. economy. Monthly job formations slowed from 386,000 newly added jobs to 223,000 in December; however, that exceeded economist expectations and is well above the pre-pandemic average in 2019 of 164,000. The labor force participation rate in December of 62.3% remains 1% below the February 2020 pre-pandemic level, and November’s 3.5% unemployment rate was the lowest in 50 years.
Wage growth had been growing rapidly, but earnings slowed in December (0.3% versus 0.4% in November) to a 4.6% annual rate. That likely provides the best hope for tempering inflation; however, will the pace of wage growth slow enough to bring inflation down to the Fed’s 2% annual target? And with unemployment at historic lows, is it realistic to assume wages will experience a rapid decline without additional layoffs? We will be watching closely for the answers, as a perception of stability in near-term economic conditions should trigger a renewed cycle of new household formation.


