

The Blackstone Saga
Michael Episcope and David Scherer, Origin Co-CEOs
A Dec. 1 Wall Street Journal article about the valuations of private REITs set in motion what is turning out to be a run on the bank. Blackstone Real Estate Income Trust Inc. (BREIT) is at the center of this controversy as the $126 billion fund appears to defy the laws of financial gravity.
With the rapid rise in interest rates, public REITs are down more than 30% this year and private market valuations have sold off from 10% to 15% on a gross basis. But BREIT is posting a 9.3% gain year to date. To be fair, Blackstone has done a great job of building a portfolio of high-quality cash-flowing assets and pairing them with long-term fixed-rate debt. The portfolio is generally invested in common equity in stabilized assets, which have been impacted the most by interest rate increases. Private asset valuations are slow to reprice because transactions are few and far between in today’s market, and fund-level valuations are part art and part science.
With a leverage ratio of 46%, it would make more sense to see BREIT post a loss this year of 20% to 25% rather than its near-double-digit gain. Rent increases this year can explain some of the lack of deterioration in pricing, but a 13% increase in same-store rents doesn’t begin to offset a 25%-to-40% increase in cap rates. As rents soften and occupancy declines, it may only be a matter of time before BREIT’s unit price catches up to reality.
Blackstone hosted a webinar a few weeks ago to address concerns and outline its valuation practices, as well as to explain the current mark-to-market value of its assets. We have a saying in our business: When you’re explaining, you’re losing. Redemption requests have exceeded the fund’s monthly limit of 2% of its net asset value and its quarterly threshold of 5%, causing Blackstone to deny liquidity to many investors.
One of Blackstone’s biggest mistakes is marketing an illiquid product to make it look more like a high-yield savings account with upside. When savings rates were close to zero, BREIT’s 5%-to-6% annual yield with liquidity after one year was hard to resist for many. Those investors have done well on paper, but if they need liquidity to pay their bills, it may not matter. The old saying, “no one gets fired for recommending Blackstone,” may be tested soon.
All open-ended funds have redemption rights, and ours do, too. The difference is that our redemption rights disincentivize short-term investing because we want partners who have a long-term view and understand that economic cycles are part of investing. Our redemption policy is an example of our risk management approach, and it was designed to avoid what’s happening at Blackstone. To date, our redemptions have been negligible. Ironically, early redemptions actually help fund investors because any penalty is paid to the fund.
We are subject to the same laws of financial gravity as Blackstone, but our portfolio is vastly different. We have not purchased a property in almost three years, and our investment activities have been the defensive strategies of developing and lending. We sold close to $500 million worth of properties in 2021 and 2022 and are well-positioned to take advantage of a market that is finally rewarding risk.
Our mantra is about protecting capital at all times. While that may mean giving up some upside during the best of times, it also means outperforming other managers in times of distress. We appreciate your subscribing to Market Monitor and being part of the Origin community.
Why We’re Watching These 2 Key Metrics
Dave Welk, Managing Director of Acquisitions
We are often asked which important variables that MultilyticsSM, our machine-learning model, considers when determining future rent growth. There are two that are most impactful: renter affordability—essentially, the ratio of rent to income—and units per capita, or supply relative to the number of people within a given Census tract. After three consecutive months of national declines in rent, we are watching changes in these two metrics closely.
Affordability, expressed as a percentage of income, is the single largest driver of rent growth or decline. Due to the rapid rise in rental rates since the onset of COVID-19 in 2020 and the failure of incomes to keep pace, the current national affordability ratio of nearly 32% is substantially higher than it has been since the Great Recession, when it peaked at more than 27% in 2008.
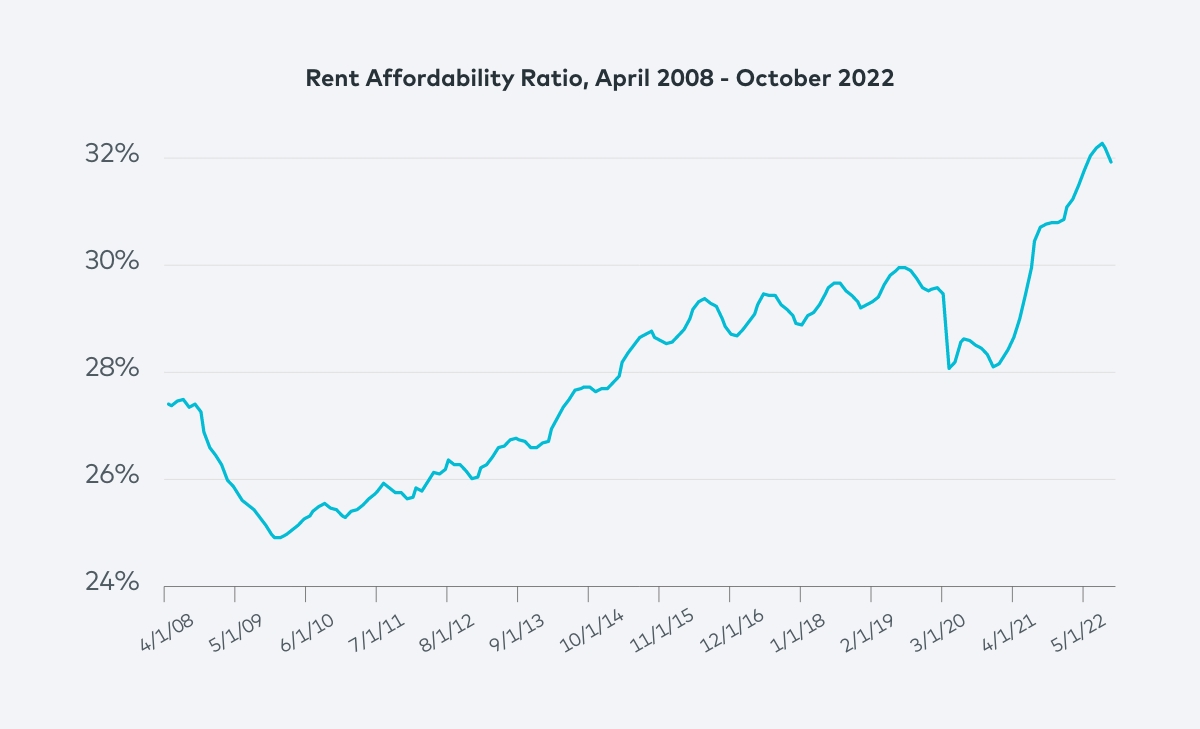
Sources: St. Louis Fed; Multilytics Index
A 5% difference in affordability doesn’t necessarily sound like a large increase. But according to the St. Louis Federal Reserve, the Consumer Price Index Less Shelter has risen 18% since COVID lows; nationally, wages over the same period have grown by only 9%, according to the Bureau of Labor Statistics. All those factors mean renters who have the technology and the flexibility to work anywhere can move to lower-priced options within a given city—or to a cheaper city altogether.
Additionally, the post-COVID expansion of the renter pool can just as easily contract if prices force renters to find roommates or move into their parents’ basements. We are keeping a close eye on household formation figures as a subset of the data that we evaluate when forecasting future demand.
As it relates to units per capita, or new units to be delivered to the market, 2023 is predicted to deliver about 565,000 units, according to Newmark Research and RealPage. The last time the industry delivered more than 400,000 units nationally in a single year was 1972. This additional supply will ease the significant shortfall of multifamily housing units, estimated at 600,000. But it will also put short-term downward pressure on rents, even though, as we have discussed previously, we will need to deliver 4.3 million new apartment units by 2035 in the U.S. to keep up with future demand.
We have been preparing for this slowdown and forecasting a negative turn for months in our underwriting. Fortunately, we see this decline in rents as short-term, as our Multilytics forecasts show affordability and supply issues abating in 2024 in nearly all our target markets. But we will continue to watch how these two leading indicators of rent growth further impact the market over the coming months.
Demand for Credit Is Slowly Returning. Will It Last?
Tom Briney, Managing Director of Acquisitions
Last month, I wrote about the challenges of limited liquidity in the U.S. Treasury market and the trickle-down effect on commercial real estate credit and property-level borrowing costs. The limited liquidity meant that spreads on bonds moved wider and borrowing costs increased across the board.
All that started to change just before Thanksgiving. On Nov. 23, the Federal Reserve released the minutes from the most recent meeting of the Federal Open Market Committee, its interest rate policy-making committee. As investors pored through those minutes and read between the tea leaves, they concluded that the board was moving away from its ultra-hawkish position on interest rate increases—even if it was just a little bit. That little bit was all that credit investors needed to see to start slowly wading back into bond investments, moving some of their cash hoards off the sidelines and improving liquidity in the process.
Since those minutes were released, there has been a tangible move back into credit products. The subsequent two weeks have seen Treasury bond yields compress from 20 to 25 basis points, or a roughly 5.5% rally. Importantly, this rally was not limited to U.S. Treasury securities but was widespread across most quality credit assets, including multifamily-backed bonds. The firm support for these bonds is now being seen in actual borrowing costs at the property level.
A 10-year fixed-rate loan with Freddie Mac today will price at an interest rate of approximately 5.50%, a decrease of more than 60 basis points since the week prior to the release of the Federal Reserve minutes. This equates to interest expense savings of $300,000 per year on a $50 million loan—enough to push a deal that was previously on the fence into a space where it makes sense. The more that deals move from “on the fence” to “good to go,” the more we will see liquidity return to the markets, and the snowball will begin to roll downhill. It’s impossible to know if this is the start of a true trend or simply the markets taking a breather on their way to higher borrowing costs, but it is a data point worth noting today and watching in the future.
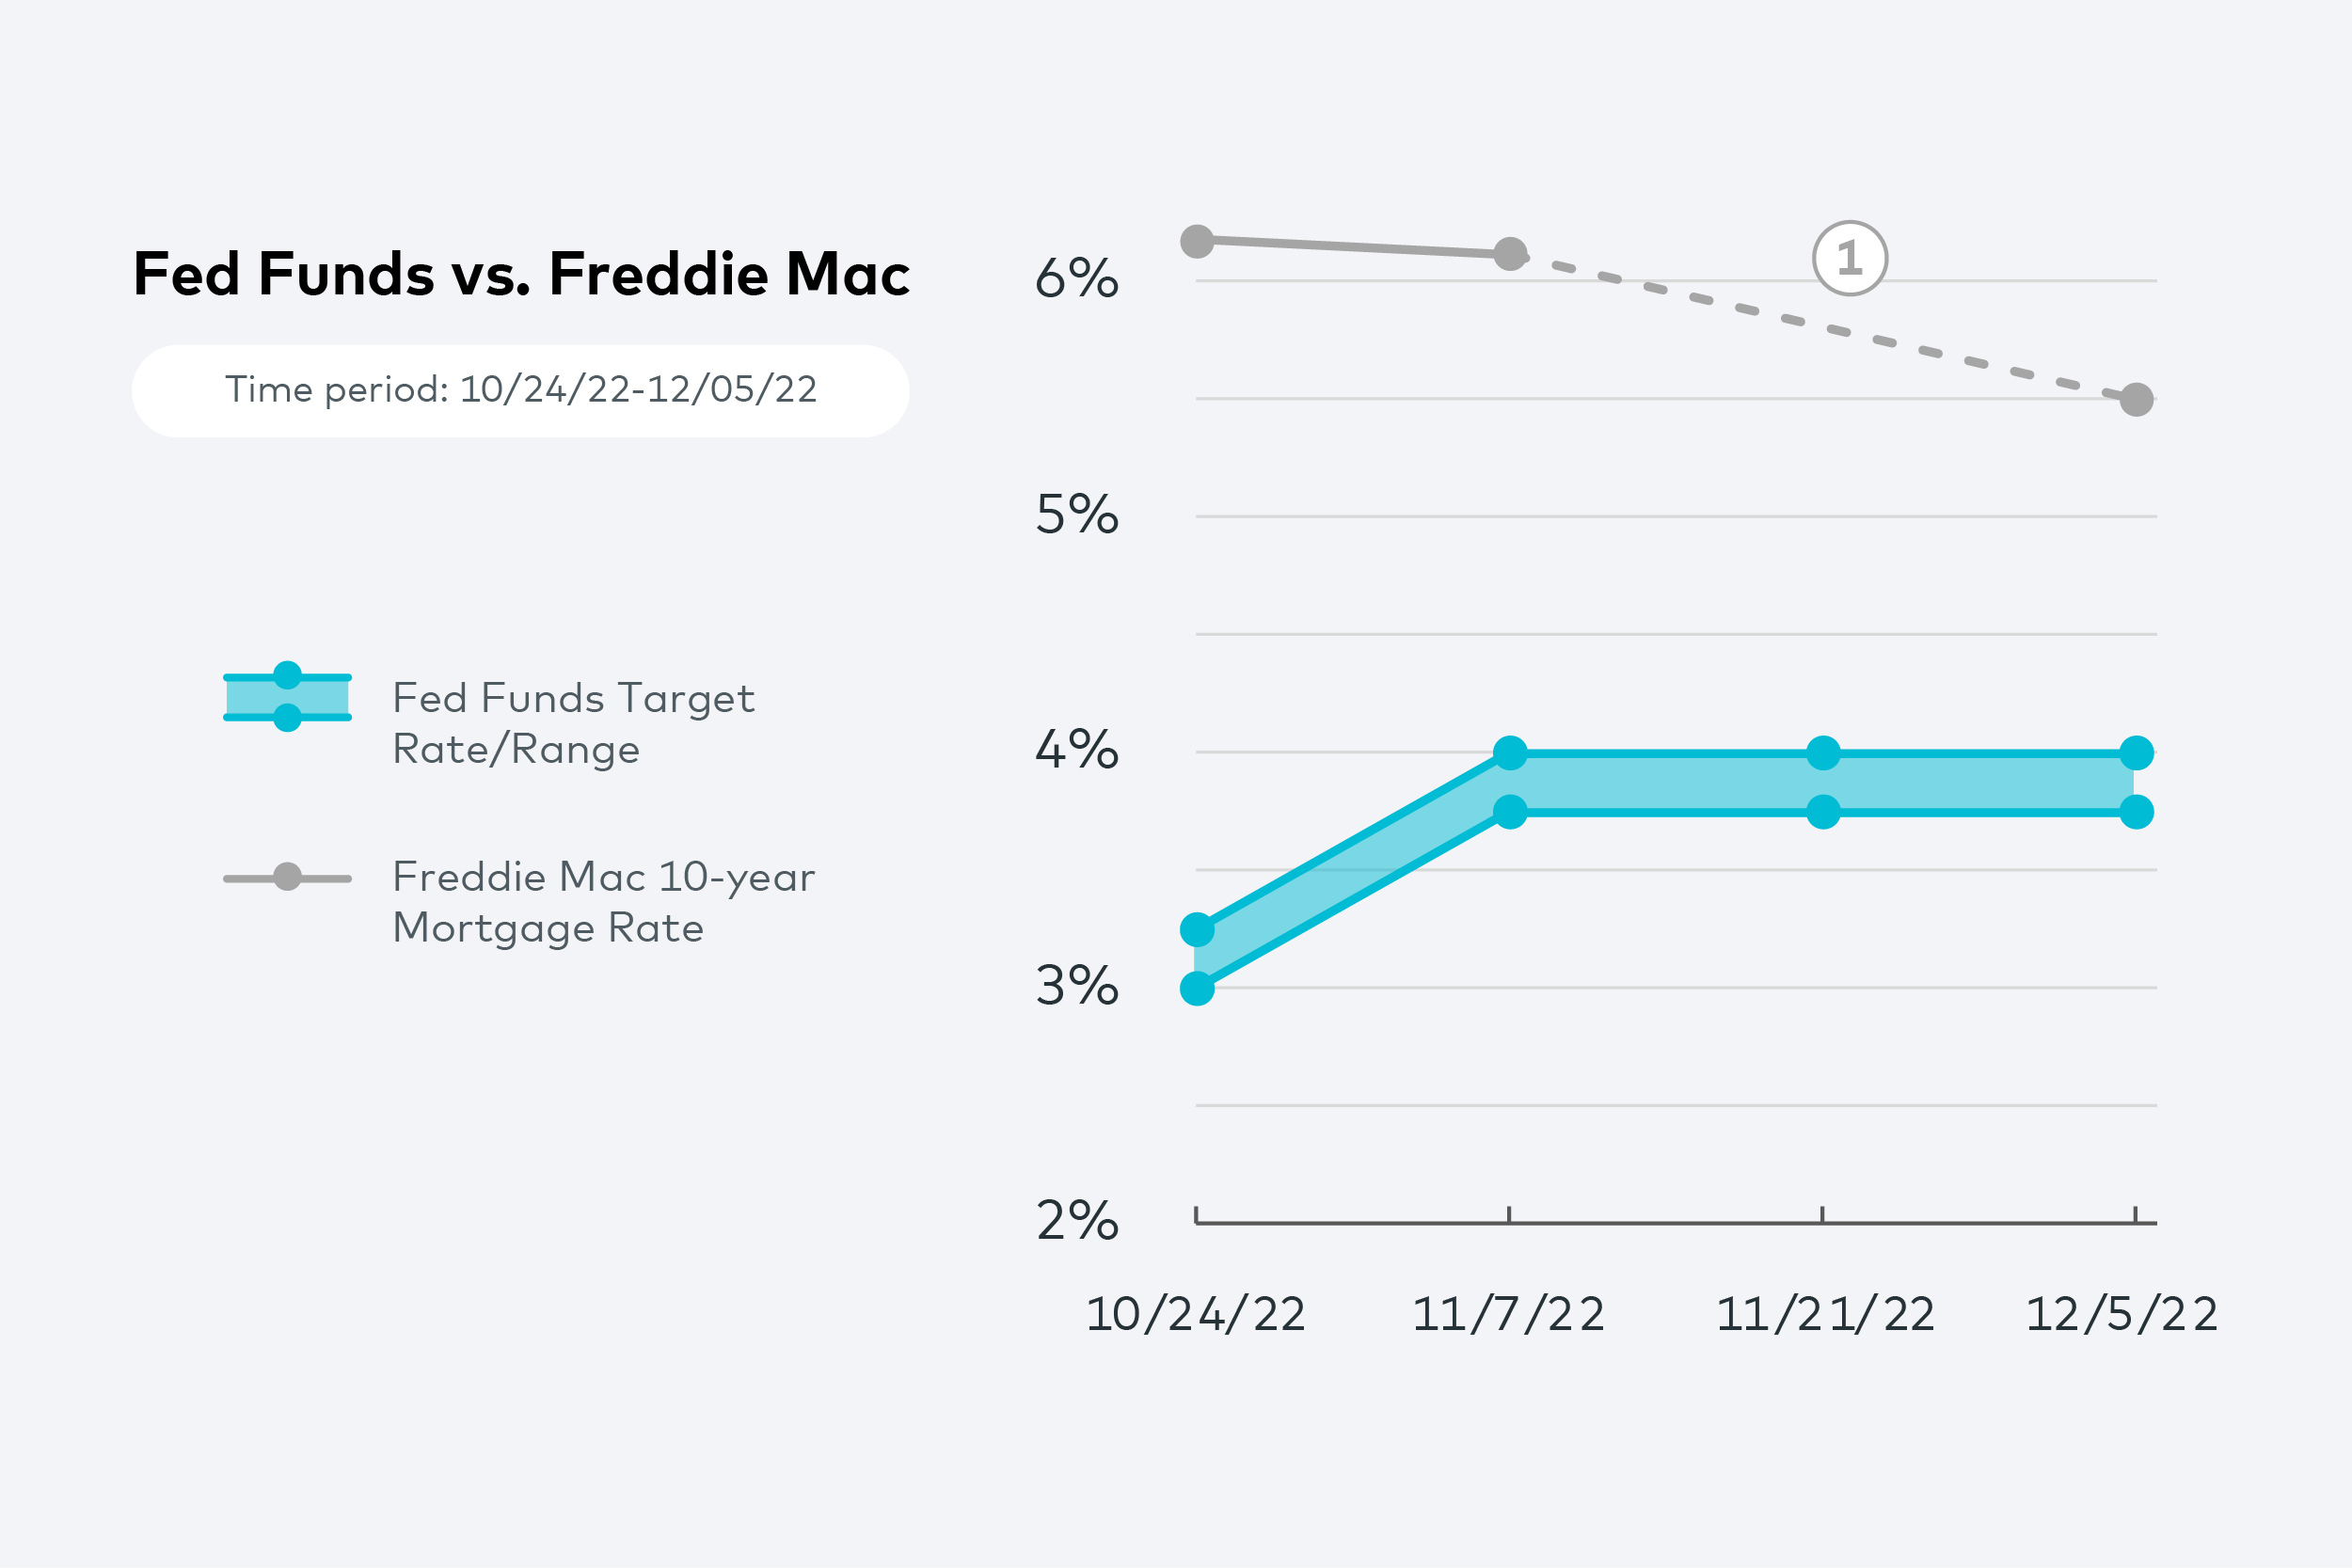
Note: Freddie Mac data was not available for Nov. 21.
Sources: Federal Reserve Bank of New York, Freddie Mac


