
Quick Take: Multifamily valuations are resetting because cap rates have risen only partly while borrowing costs surged, and a historic supply wave pressured rents at the same time. Apartment values sit roughly 17.6% to 22% below their 2022 peak, depending on the index. Values appear to have stabilized, but a durable recovery depends on cap rates compressing, not just on expected rate cuts.
Multifamily values are down meaningfully from their 2022 peak. Cap rates did expand, but only partially relative to the run-up in the risk-free rate and the cost of debt: multifamily cap rates have moved on the order of 150–190 basis points off their 2021/22 trough, while the 10-year Treasury and the cost of multifamily debt have moved considerably further over the same period.1
That spread compression, layered on top of a historic supply wave and a near-frozen transaction market, has produced one of the most meaningful valuation resets the multifamily sector has experienced in the past two decades, though, consistent with NCREIF’s own reporting, the overall magnitude has remained meaningfully shallower than the roughly 30% declines recorded during the 2008–09 financial crisis.2 Understanding the mechanics matters for anyone evaluating Origin’s funds today, because the reset cuts two ways: it pressures legacy marks, and may create opportunities for future acquisitions.
| Multifamily cap rate movement off the 2021/22 trough | ~150–190 bps |
| Hypothetical implied value decline from a 4.1% to 5.1% cap rate, income held flat | ~19.6% |
| Range of peak-to-trough value declines across apartment-sector indices cited in this piece | 17.6–22% |
1. The Cap Rate Math: A Spread Story, Not a Simple Rate Story
Multifamily cap rates bottomed in late 2021 and early 2022, in the high-3% to low-4% range, as years of near-zero rates pushed investors to accept thinner income yields in exchange for growth. When the Federal Reserve began raising rates in 2022, cap rates followed, but slowly and by a fraction of the move in borrowing costs.
Conceptual Illustration: Cap Rates Rose, But Not as Fast as Financing Costs
Order-of-magnitude comparison since the late-2021/early-2022 trough, not a plotted data series
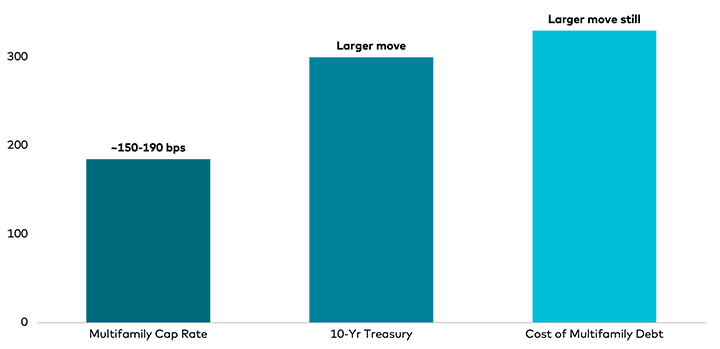
The critical point: the increase in cap rates has not fully offset the increase in mortgage rates over the same period. A buyer financing an acquisition today is paying a meaningfully higher cost of debt than the cap rate expansion has compensated for, which is why unlevered going-in yields that looked attractive on paper in 2023–2024 often still didn’t pencil against the cost of leverage.
Why Cap Rates Lag Rather Than Reprice Instantly
Cap rates are not a real-time market price. They are set through appraisals and a comparatively thin set of actual transactions, so they adjust with a delay relative to how buyers and sellers are actually underwriting deals in the moment. When the cost of debt exceeds the unlevered yield a property generates, a condition sometimes called negative leverage, where borrowing to buy the asset dilutes rather than boosts returns, buyers pull back even before appraised cap rates catch up. This lag explains why institutional, appraisal-based indices and transaction-based indices tell different versions of the same story (see below), and it is the same mechanism behind the gap between a publicly traded fund’s NAV and what the portfolio might fetch in a live sale process today.
2. What the Indices Show
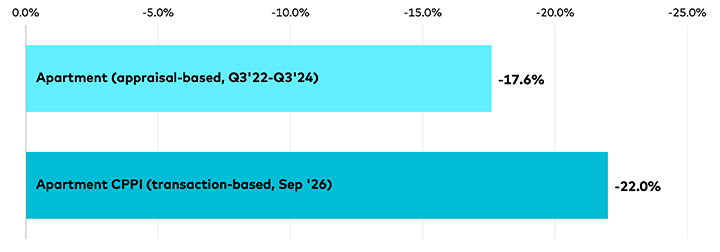
Two different methodologies capture two different stages of the repricing, and the spread between them is itself informative. The figures below are matched to the apartment sector specifically (not all-property indices). NCREIF’s figure reflects its most recently reported apartment trough (Q3 2024); the index overall has posted multiple consecutive quarters of positive total returns since, per NCREIF’s Q3 2026 release. Green Street’s figure is a continuously updated, transaction-based reading, most recently as of September 2026, the two are not on a common as-of date; which is itself a reflection of the appraisal lag described below.4
| Index | Methodology | Apartment-Sector Signal |
|---|---|---|
| NCREIF Property Index (Apartment) | Appraisal-based, institutional | Apartment-sector values declined roughly 17.6% from the Q3 2022 peak to the Q3 2024 trough |
| Green Street CPPI (Apartment) | Transaction-based, forward-looking | Apartment values remained roughly 22% below the 2022 peak as of September 2026, down about 4% year-over-year |
Peak-to-trough value decline by index methodology, apartment sector only
3. Two Reinforcing Forces Beyond Rates
A Historic Supply Wave Hit NOI Growth at the Same Time Cap Rates Were Expanding
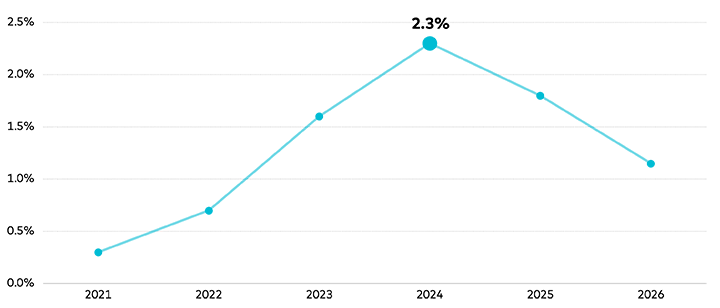
Multifamily completions reached a cyclical peak around year-end 2024, commonly cited at approximately 2.3% of existing stock delivered in a single year, the tail end of the post-pandemic construction boom.5 That supply landed disproportionately in Sunbelt and high-growth metros just as the cost of capital was rising, compressing rent growth and, in some submarkets, pushing concessions back into the market. The result was a double hit: cap rates expanding while the NOI side of the value equation also softened, rather than offsetting the move.
Conceptual Illustration: New Supply Peaked in 2024, Then Began Rolling Over
Illustrative shape of the completions cycle, not a specific plotted data series
Multifamily Lending Volume Collapsed, Reinforcing the Appraisal Lag
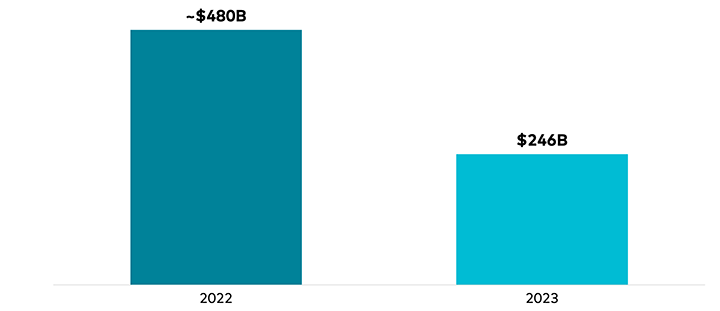
Multifamily mortgage origination volume roughly halved from 2022 to 2023 as elevated and volatile rates, falling values, and softer property performance kept borrowers and lenders apart on terms. Origination volume is a proxy for, not identical to, sales transaction activity. Still, the same forces that suppressed lending also kept property sales thin, leaving appraisers with less live transaction data to mark portfolios against and reinforcing the lag discussed above.
Multifamily Lending Volume Roughly Halved, Thinning the Data Appraisers Rely On
U.S. multifamily mortgage origination volume, $ billions, 2022 vs. 2023
4. Where Things Stand Now
Cap rates have largely stopped rising but have not meaningfully compressed either. Through 2025, multifamily cap rates were essentially flat year-over-year, a reflection of rates staying elevated even as the Fed began cutting rates. Market commentary through the first half of 2026, reflecting Origin’s own synthesis of publicly available reporting, rather than a single cited source, describes price gains as modest because cap rates remain sticky at a level consistent with the higher-for-longer rate backdrop.6
The setup: values appear to have stabilized well below the 2022 peak, but a durable recovery depends on realized Fed rate cuts translating into cap rate compression, not just the expectation of cuts. That distinction matters for underwriting discipline on any new acquisitions made during this window. The acquisition opportunity itself rests on three concrete mechanics: pricing in many submarkets now sits below replacement cost, meaning new construction is harder to justify and existing assets become relatively more attractive; a wave of 2026–2028 debt maturities (see Section 5) is pushing some owners toward forced or motivated sales; and the construction pipeline has thinned meaningfully from its 2024 peak, reducing future competitive supply for assets acquired today.
5. Why Multifamily, Why Origin
A reset of this magnitude invites a reasonable question: why stay in the sector at all? The answer rests on the same structural case that has defined Origin’s exclusive focus on multifamily since inception, and it holds, independent of where cap rates sit in a given quarter.
- Housing is a need, not a want. Shelter is a non-discretionary expense: it sits at the top of most households’ payment stack, ahead of credit cards, auto loans, and discretionary spending, and that demand doesn’t disappear in a downturn the way office and retail demand did during COVID-19.
- The U.S. has a structural housing shortage. Commonly cited third-party estimates put the shortfall at roughly 4 million homes nationally, with annual completions running below the approximately 1.5 million units some estimates suggest are needed to keep pace with demand.7 These figures describe the overall U.S. housing stock (for-sale and rental, single-family and multifamily combined), not multifamily supply specifically. Multifamily completions are addressed separately in Section 3.
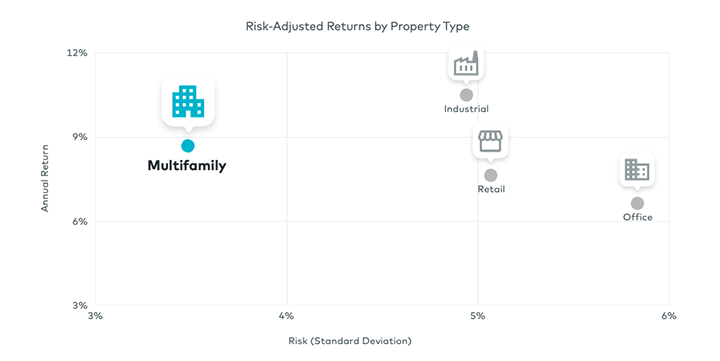
- Multifamily has historically delivered higher risk-adjusted returns than other property types, with an important caveat. Based on NCREIF Property Index data over multi-decade periods, multifamily has generated a more favorable return-per-unit-of-volatility profile than industrial, retail, and office. Because NCREIF values are appraisal-based, they are smoothed relative to real-time transaction pricing, which likely understates actual volatility (including the magnitude of drawdowns) across all property types shown, not just multifamily.8
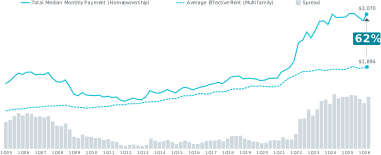
The affordability math reinforces the demand side of this thesis directly. The cost of owning a home has pulled sharply away from the cost of renting, which is precisely the dynamic keeping renters in the pool longer and supporting the rent growth multifamily owners depend on.
Steep Homeownership Costs Bolster Today’s Rental Market
High interest rates and elevated home prices have pushed mortgage costs out of reach for many, while rents remain comparatively stable. This affordability gap drives demand for multifamily housing.9
Why Origin’s IncomePlus Fund
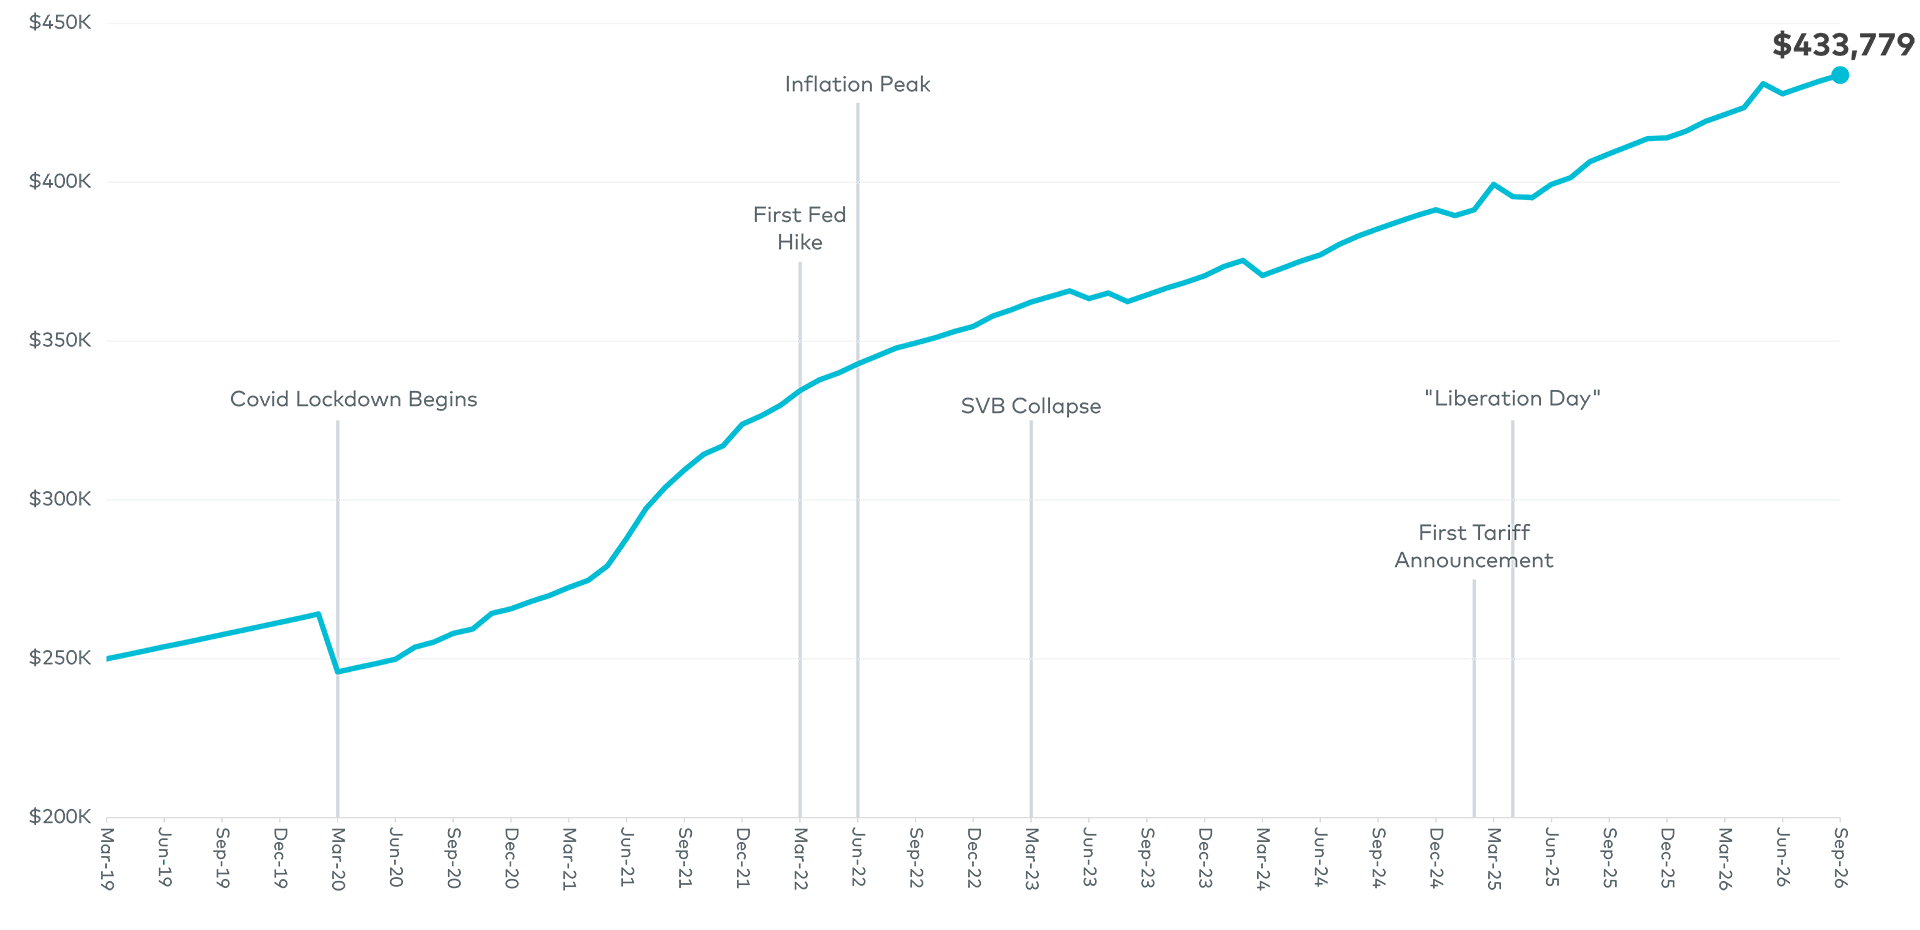
Performance through volatility: Origin’s IncomePlus fund has navigated this cycle by maintaining meaningful exposure to the senior part of the capital stack. As of its most recent fact sheet (September 2026), the fund’s portfolio allocation was approximately 48% direct financing, 43% core-plus stabilized multifamily, 7% build-to-core development, and 2% cash.10 A $250,000 investment in the fund at inception (3/31/2019), assuming participation in the fund’s distribution reinvestment plan (DRIP), has grown to approximately $429,95010 through 7/31/2026 on a net-of-fees basis, a period spanning COVID-19, the fastest Fed hiking cycle in decades, the SVB collapse, and the 2025 tariff shock.
This since-inception figure reflects the net cumulative result across that period. It does not mean the fund’s NAV avoided decline at any point along the way. Fund-level NAV has fluctuated within the period shown, including a reported monthly decline in mid-2026; the $429,950 figure is the result after those fluctuations, not evidence of an absence of drawdowns.10
Why IncomePlus: the fund was built as an “all-weather” multifamily vehicle precisely for a cycle like this one and it can tilt dynamically across preferred equity/direct financing, core-plus stabilized assets, and build-to-core development rather than being locked into a single risk posture. With valuations resetting and new supply slowing, the fund may shift back toward operating assets and ground-up development to capture potential appreciation alongside income as the cycle turns.
The All-Weather Fund
Growth of a $250K IncomePlus Fund Investment Since Inception*
Why Origin’s Credit Offering
Engineered for every cycle: Origin’s credit offering (offered by Origin Credit Advisers, an affiliate of Origin Investments) was structured with income and capital preservation as its primary objective, a positioning that comes from where the fund sits in the capital stack rather than from any single return figure. The fund invests senior to common equity, meaning its capital is generally repaid ahead of equity holders in the loans it originates and acquires, a structural buffer intended to help absorb the kind of volatility multifamily values have experienced since 2022 before it reaches the fund’s own capital. That structure is intended to address the fund’s answer to a volatile rate environment.
The valuation reset described above is precisely what is driving the opportunity Origin’s credit offering is built to capture. More than $1.8 trillion in multifamily-sector debt is scheduled to mature over the next decade, with roughly $757 billion coming due between 2026 and 2028 alone, according to Mortgage Bankers Association data, as reported by The Wall Street Journal and The Real Deal (September 2026).12 Separately, banks have been pulling back from commercial real estate lending and ceding ground to non-bank lenders, and net absorption outpaced new deliveries for a second consecutive quarter in Q2 2026, per CBRE U.S. Multifamily figures, a supply-demand dynamic that may be favorable for collateral performance.13 Origin’s credit offering targets current income with capital preservation as its primary objective and offers a REIT pass-through structure.
Origin’s credit offering’s REIT pass-through structure may allow certain qualifying investors to deduct up to 20% of qualifying ordinary REIT income on their federal tax returns, subject to individual eligibility, holding-period, and income-limitation requirements.
No performance information included: no return, yield, NAV-growth, or benchmark-comparison data for Origin’s credit offering is presented in this section. Investors and prospective investors seeking performance information for Origin’s credit offering should contact Origin Investments’ Investor Services team or refer to the fund’s current prospectus.
This is not tax advice. Availability and amount of any deduction depends on each investor’s individual tax situation; investors should consult their own tax advisor.
Footnote:
As-of date alignment: IncomePlus Fund figures above are stated as of 7/31/2026 (its standard monthly NAV reporting cycle). The debt-maturity and market-structure figures in this section are dated separately (per MBA/CBRE reporting cited inline). Figures are not intended to be read as of a single common date.
Sources:
1. Spread quantification. Cap rate, Treasury, and multifamily debt-cost movement since the late-2021/early-2022 trough are order-of-magnitude comparisons based on Green Street cap-rate commentary and Federal Reserve (FRED) Treasury/mortgage-rate series; precise indexed values were not independently re-verified for this comparison.
2. GFC comparison. Per NCREIF reporting, the institutional property market value index had declined roughly 16.5% from its Q2 2022 peak as of mid-2024 — “still significantly less of a drop than occurred during the financial crisis in 2008 and 2009 when values declined by almost 30%” (NCREIF). This reset is being characterized as significant in duration and breadth, not as exceeding GFC-era depth.
3. Illustrative/conceptual charts. Where noted, charts in this piece are conceptual illustrations of relative magnitude or directional shape, not plotted from a specific indexed data series, even where directionally consistent with the named sources’ published commentary.
4. Section 2 apartment-sector data. NCREIF Property Index apartment subindex: cumulative appreciation peaked Q3 2022, bottomed Q3 2024, down approximately 17.6%. NCREIF has not published a more recent apartment-specific peak-to-trough update superseding this Q3 2024 trough figure as of this writing; the index overall has posted multiple consecutive quarters of positive total returns since, per NCREIF’s Q3 2026 release. Green Street Commercial Property Price Index, apartment sector: approximately 22% below the March 2022 peak and approximately 4% below year-over-year, per the index release covering September 2026 (reported October 2026).
5. Completions peak. The ~2.3% of existing stock figure for year-end 2024 multifamily completions is a commonly cited industry approximation consistent with RealPage/Yardi Matrix supply reporting; Yardi Matrix separately reported a 2024 completions peak of approximately 697,000 units nationally.
6. Market commentary, first half of 2026. This statement reflects Origin’s own synthesis of publicly available market commentary (including Green Street’s published observation that “price gains have been modest because cap rates continue to be quite sticky”) rather than a single attributed source, and is subject to change without notice.
7. Housing shortage figures, scope. The ~4 million home shortage and ~1.5 million annual completions figures are commonly cited third-party estimates of the total U.S. housing shortfall (for-sale and rental, all structure types) and are not multifamily-specific.
8. Risk-adjusted return basis. Based on NCREIF Property Index data over multi-decade periods, an unleveraged, appraisal-based composite. Appraisal-based valuations are smoothed relative to real-time transaction pricing and therefore likely understate actual return volatility, including drawdown magnitude, across all property types shown.
9. Homeownership vs. rent data. Source: Newmark Research, RealPage, Federal Reserve Bank of Atlanta, as of July 21, 2026. Figures are subject to revision as updated data becomes available.
10. IncomePlus Fund performance disclosure. A $250,000 investment in the fund at inception (3/31/2019) has grown to approximately $429,950 through 7/31/2026. Returns are net of fees and inclusive of appreciation and reinvestment of distributions. Past performance is no guarantee of future results; an investment in the Fund has the potential for partial or complete loss of invested capital; returns are not guaranteed. The Fund’s target return of 9%–11% net annual return is a goal only, is not a guarantee or prediction of actual results, and may not be achieved. Figures are unaudited and subject to adjustment. Portfolio allocation percentages as of the fund’s September 2026 fact sheet and are subject to change.
11. Multifamily lending volume. Origination volume ($246.2B in 2023, down 49% from ~$480B in 2022) is sourced from Mortgage Bankers Association (MBA) multifamily mortgage origination data. This measures lending activity, not sales transaction counts; it is used here as a correlated proxy for the broader slowdown in deal activity during this period, not as a direct transaction-volume metric.
12. Multifamily debt maturity figures. $1.8 trillion over the next decade and approximately $757 billion due 2026–2028 are multifamily-sector-specific figures per Mortgage Bankers Association data, as reported by The Wall Street Journal and The Real Deal, September 2026. These are market/industry statistics, not performance figures for Origin’s credit offering.
13. Absorption vs. deliveries. Net absorption outpacing new deliveries in Q2 2026 is per CBRE U.S. Multifamily figures — a market-level supply/demand statistic, not a performance figure for Origin’s credit offering.