

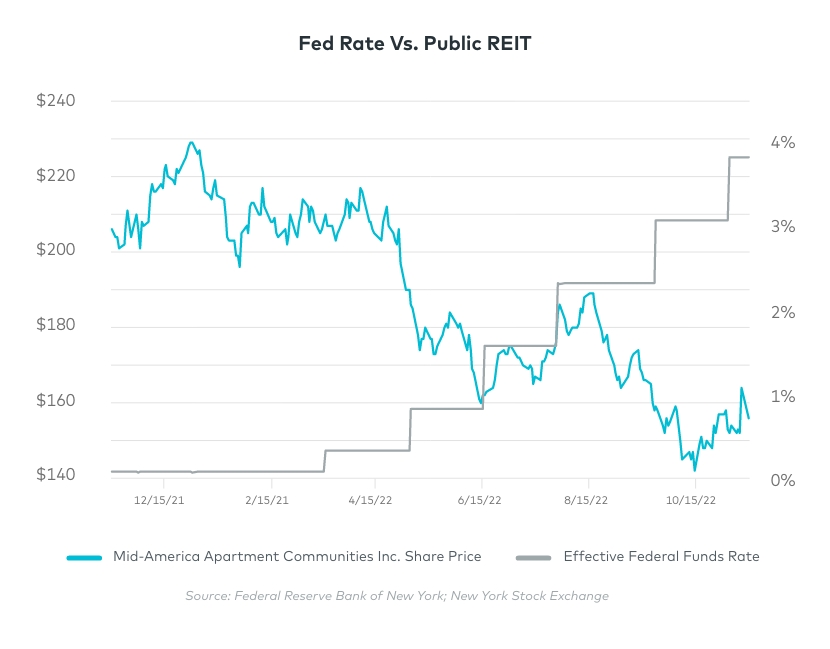
How is it possible that the Origin IncomePlus Fund’s unit price continues to increase even amid substantial challenges in the real estate market? In the past 10 months, the 10-year interest rate rose to more than 4%, the Fed went on a tightening spree and won’t stop until inflation gets below 2%, mortgage rates have topped 7%, public REIT stocks are down more than 30%, and real estate capital markets have screeched to a halt with lenders and buyers on the sidelines.
The IncomePlus Fund is an open-ended Fund, and investors who enter it are acquiring assets at fair market value. This value is determined by a valuation process that has been approved by our auditors and adheres to industry best practices. Fair market value determines the price at which new investors acquire units and the basis to redeem units; wealth managers use it to calculate their assets under management.
All three parts of the Fund offer upside to existing and new investors, and we are excited about the Fund’s prospects. Our defensive strategy for the past two years is paying dividends, even with significant changes in the economy since the beginning of the year.
How the Portfolio and Valuation Process Impact the Unit Price
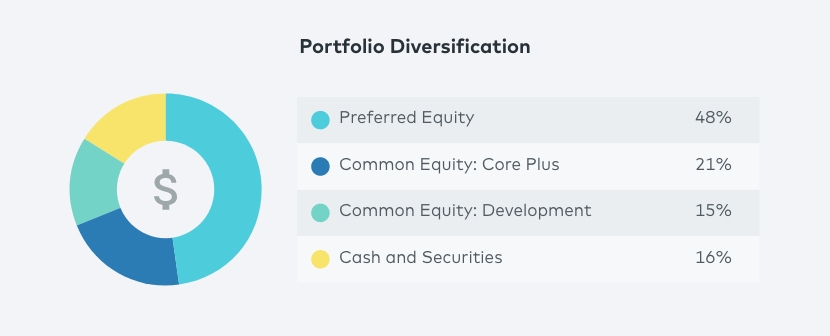
There are two reasons the Fund’s unit price is not declining. To help explain those, you’ll see an in-depth analysis of the Fund’s property-level valuations below. The first reason is due to our portfolio allocation. The IncomePlus Fund is a multi-strategy investment vehicle that builds, buys and lends to Class A multifamily properties across the southwest and southeast U.S. We have spent the past two years only investing new capital in preferred equity and ground-up development projects. We did this proactively to defensively position this Fund for a market downturn.
The makeup of the Fund’s portfolio today is 64% in cash and preferred equity, 15% in common equity (development) and 21% in common equity (core plus) assets. The tilt toward preferred equity provides the portfolio with significant downside protection and a steady source of return, as these assets accrue interest at a little more than 1% per month. The development projects provide us with an opportunity to invest at a lower basis because even 10-year-old properties have been trading well above replacement cost.
The second reason the Fund’s unit price is not declining is that even as pricing for multifamily properties increased, we adopted a conservative approach to valuation over the past 12 months, incorporating long-term fundamentals and ignoring short-term market distortions. The recent decline in values in the broader market means that prices are coming in line with our own valuation levels.
The table below shows most of our preferred equity investments and the amount invested. These investments produce an average yield of 12.1% and originated at a loan to cost of roughly 82%. At today’s values, this equates to an average loan to value of roughly 75%. These are well-protected positions.

Stress-Testing the Fund’s Preferred Equity Portfolio
An important part of our conservative approach to valuation is our underwriting process. In the chart below, the second column, underwritten rents, are the rents approved by our investment committee. The next column represents a stress test, which allows us to manipulate our data to show how our assets will perform in negative economic scenarios. In this stress test, we reduced monthly rents at each asset by $200 and applied a 4.75% cap rate to arrive at the value at stabilization. This stress test is simple, but keep in mind that market declines don’t typically happen in a linear fashion like this because markets are dynamic and grow and contract at different rates.
The next column shows the loan to value (LTV) of our investment relative to the value of the property at stabilization. If the LTV exceeds 100%, we will get less than our original investment back if the property were sold. In this scenario, five assets exceed 100% LTV and would be impaired. The fifth column shows the returns using rent-growth forecasts from Origin MultilyticsSM, our proprietary machine learning tool that predicts future rent growth, and a 4.5% cap rate to get a more accurate picture.
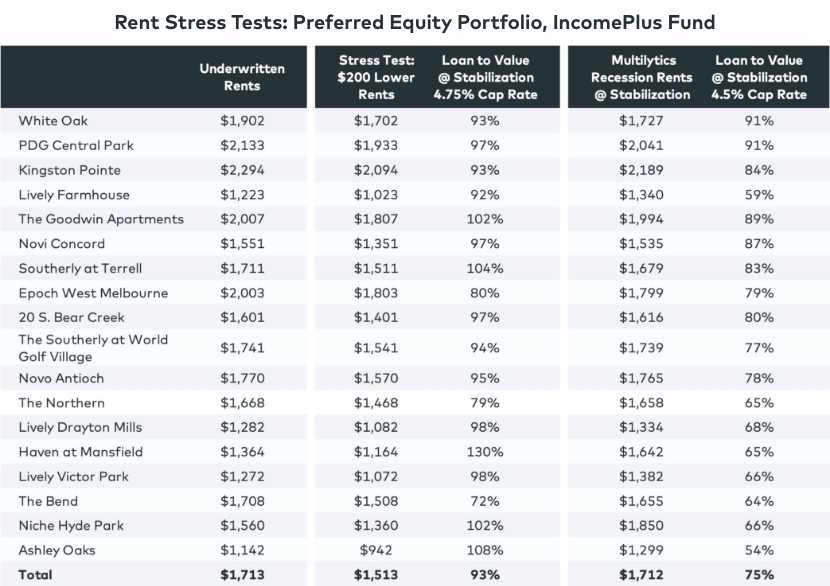
In each scenario, the LTV is less than 100%, with two investments at or slightly above 90% LTV. If these assets were to be sold at completion, we would recoup our entire investment. The reality, though, is that common equity investors would not want to sell an asset at a loss, so we would either take a small impairment to avoid a legal battle or renegotiate terms.
Our valuation policy requires us to take impairments on preferred equity positions under certain conditions, and because of recent changes in interest rates, we have updated our policy to include a mark to market accounting practice. Our preferred equity investments are valued either at par value, the amount it will be worth at maturity (including accrued preferred return), or based on the discounting of the future expected cash flows at a market rate of return. This approach is predicated on the belief that the asset will ultimately be worth a value that exceeds the senior loan and our preferred equity balance, plus the return accrued to the expected date of repayment. We previously established return benchmarks for determining when a preferred equity investment’s value might be impaired and amended our policy to alleviate concerns expressed by investors.
In many cases in the chart above, Multilytics’ rents are higher than our underwritten rents. There’s a simple explanation for that: When underwriting a deal, our acquisition team employs the concept of margin of safety and presents both the forecasted rents and the rents that make the deal work. Forecasted rents always are the ceiling. If the project can work with lower rents, then that’s how it is presented and approved. The underwritten rents above represent the approved rents. In most cases, the forecasted rents were much higher.
Stress-Testing the Fund’s Development Portfolio
The development portfolio (chart below) consists of five assets capitalized with total Fund equity of $55.35 million. In this scenario, the original pro forma is on the left with a recession rent forecast on the right. These investments were capitalized using an average 65% senior debt and underwritten to an average return on cost of 5.58%. The return on cost is calculated by taking the net operating income at stabilization and dividing it by the cost of the project. The difference between the return on cost and prevailing cap rates represents the project’s gross margin. Our development opportunities require a minimum gross margin of 30% at the time of underwriting, and this margin has helped us greatly in today’s environment as cap rates increased from sub-3.5% to around 4.5% in today’s market.
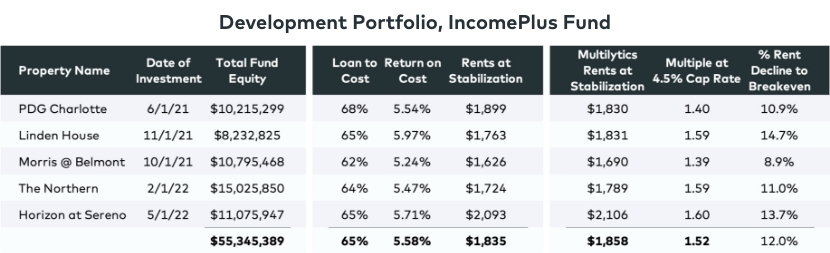
The “multiple at 4.5% cap rate” column captures the return on our investment using Multilytics’ rents and a 4.5% cap rate. The next column, “% rent decline to breakeven,” represents how much these predicted rents would have to decline before our capital is at risk.
There’s only a small spread between our underwritten rents and Multilytics’ rents because these properties are in fast-growing markets. Our development projects have a much higher standard in market selection because we are the first dollar of risk and need to be positioned in high-growth markets. Preferred equity investments can still work in lower-growth markets because of the protection in the capital stack.
Stress-Testing the Fund’s Stabilized Common Equity Portfolio
The third part of the portfolio includes our three stabilized common equity deals (chart below), which have an equity value of $70.47 million. These deals are the most susceptible to market forces because the equity is the first loss, and the ability to add value and increase revenue is limited compared to ground-up development.

This part of the portfolio should be most concerning, because an increase in cap rates to 4.25% from 3.5% can wipe out 50% of equity, depending on leverage.
The most important column in the chart above is the valuation cap rate, which represents the cap rate as of the Sept. 30, 2022, valuation. The elevated cap rates are not the result of marking assets down. Rather, we have not marked them up as much as we could have. Revenue has increased significantly over our hold period in all three of these assets, but the investment management team, in anticipation of potential cap rate expansion driven by moderating rent growth and higher costs of debt, maintained values at conservative levels. When new investors acquire Fund units, they are buying into these assets at these prices, which were calculated using the rents and cap rates in the above chart. The far-right column shows the five-year compounded annual growth (CAG) rate of revenue for each asset according to Multilytics’ recessionary forecasts.
We have only three stabilized deals in this portfolio because we stopped buying built properties after the COVID-19 pandemic and focused on investing in preferred equity and ground-up development. Ultimately, our ground-up projects, once stabilized, will move into the stabilized part of the portfolio, and we will add new developments, so the Fund always has 15% to 20% exposure to ground-up development.
Since the Fund was created in 2019, we have protected and grown our investors’ wealth. While we can’t predict the future, our defensive position and risk-management mindset puts us in the best possible position to prepare for it.


