

The Great Special Transfer
Tom Briney, National Head of Debt Investments
One of the more interesting pieces of news in the past couple of weeks is a move by Blackstone Inc. to transfer a loan, collateralized by one of its New York City portfolios, into special servicing. The $270.3 million loan is structured as a commercial mortgage-backed securities pool and collateralized by 11 properties throughout Manhattan. The underlying collateral appears to be performing well, with net operating income (NOI) increasing roughly 25% over the past two years, a healthy performance by any standard. So, what does it mean to transfer to special servicing, and why is such a large portfolio, of seemingly healthy assets, in that space?
When a loan is performing as designed, the borrower pays monthly principal and interest payments, the lender receives those payments, and a master servicer handles the monthly transactions. Other than accounting for these payments and monitoring the health of the loan, the master servicer’s role is quite limited. If a loan is not performing as expected or there is an expectation that the loan will not continue to perform as expected, it is transferred to special servicing—a sort of loan purgatory. The special servicer has more latitude to work with the borrower and the lender to either get the loan to perform as planned or be foreclosed upon.
The real estate in the Blackstone loan pool had been financed with a floating rate structure, with SOFR as the index benchmark. The interest rate on the loan has risen so rapidly that the 25% increase in NOI since 2020 can’t keep up with the increasing loan payments. Blackstone is not alone in its exposure to rising interest rates. In 2009, the absolute peak of stress during the Great Recession, 207 multifamily loans were transferred to special servicing; the all-time low of 35 occurred in 2018. Since then, the number of loans moving to loan purgatory—a leading indicator of distress—has been climbing steadily. Last year, 134 multifamily loans moved to special servicing, only 35% below the peak in 2009.
Hundreds of billions of dollars in new floating rate multifamily loan originations are completed annually in the United States, slightly less than half of which are structured with floating interest rates. It’s nearly impossible to know how many aren’t hedged against rapid interest rate increases. But it’s safe to say there will be many more instances of interest rates outpacing NOI, and borrowers being forced to transfer their loans into special servicing. If interest rates remain high, the problem will accelerate due not only to rising interest rates but also slowing NOI growth. This is the beginning of the “Great Special Transfer,” and I won’t be surprised if we see the number of assets transferred into special servicing exceeding the 2009 peak, though I hope I am wrong!
CMBS Multifamily Loans Transferred to Special Servicing
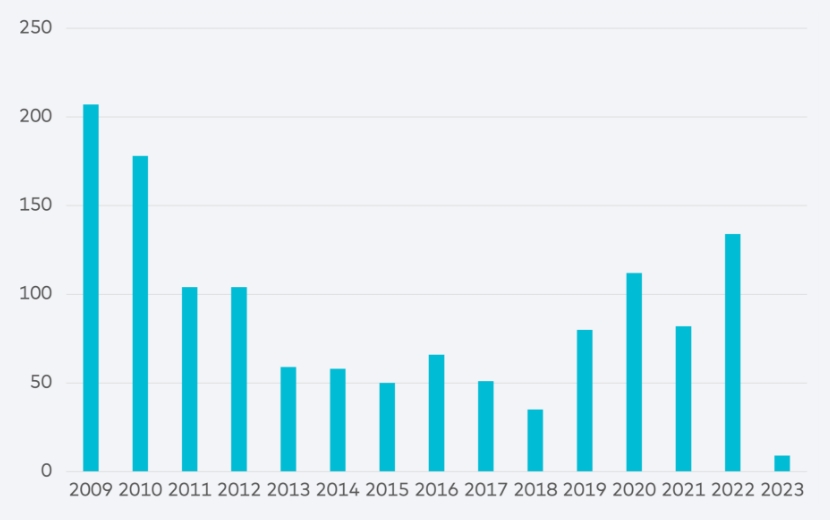
Source: Bloomberg
Note: This chart represents loans that were previously part of a publicly traded commercial mortgage-backed security (CMBS) pool. Substantially more loans were held by private institutions, such as banks and life insurance companies; they are not included in the chart.
A Deep Dive into Material Prices
Kevin Miller, Vice President of Development
As Market Monitor observed in November, construction prices declined in Q4 2022. So far this year, pricing has remained relatively flat, and we have wondered: Is this just a lag in the market as construction starts have slowed, or will construction pricing remain at this more elevated level?
Three components factor into subcontractor pricing: labor, materials and equipment. Each makes up from 20% to 45% of the total direct construction budget. This week, we’re zeroing in on construction material prices. According to the Federal Reserve Economic Data (FRED) Construction Materials Producer Price Index, the highest percentage year-over-year increase in construction materials in the index’s 75-year history was in 2021—a 27% increase over 2020. And 2022 was third highest, increasing 12.5% over 2021.
While the aggregate impact of those two years is staggering to contemplate, one can simply recall the headlines to remember why. High demand and low labor availability due to COVID-related restrictions, along with the war in Ukraine and an aging blue-collar workforce, drove historically high commodity and transportation prices.
Starting in mid-2022, residential homebuilder demand began to fall, China reversed its zero-COVID policy, and backlogs at ports cleared up, among other factors. We saw the impact quickly in several leading indicators: Lumber futures plummeted from near-historic highs of $1,250 per thousand board feet to their current $400 to $500. Global shipping rates, as measured by the Freightos Baltic Index (FBX), fell to $2,000 per 40-foot containers from $8,500. And the S&P Global Commodities Index (SPGSCI) fell from a five-year high of $853 to around $575 to $600. Starting in June 2022, month-over-month material pricing turned negative and stayed that way into January.
These factors helped blunt the impact of rising interest rates on new developments. What can we expect for the rest of 2023?
Before the pandemic, lumber futures traded at a five-year average of about $350; global shipping rates were about $1,400; and the SPGSCI traded between $290 and $485 for the five years leading up to 2020. The pre-pandemic five-, 10- and 20-year average annual growth rates for the FRED Construction Materials PPI were 2.32%, 2.11% and 2.53%, respectively. Today’s construction material prices are about 25% higher than pre-pandemic pricing trends would suggest. However, looking back over the history of the FRED Construction Materials PPI, we rarely—apart from the Great Recession—see steep decreases in pricing after sharp increases. More typically, we see a new benchmark, followed by prolonged periods of flat to slightly negative price changes, before the next run-up in demand.
It’s fair to expect construction material pricing to face downward pressure through 2023, but it also seems that it would take a dramatic demand shock to bring construction material prices back in line with pre-pandemic pricing norms. While pricing stability creates more predictability, it is only part of a development environment that includes falling rents and elevated interest rates. Even a decline in construction prices probably will not be enough to keep the pace of construction starts in line with the past two years.
Producer Price Index by Commodity: Construction Materials
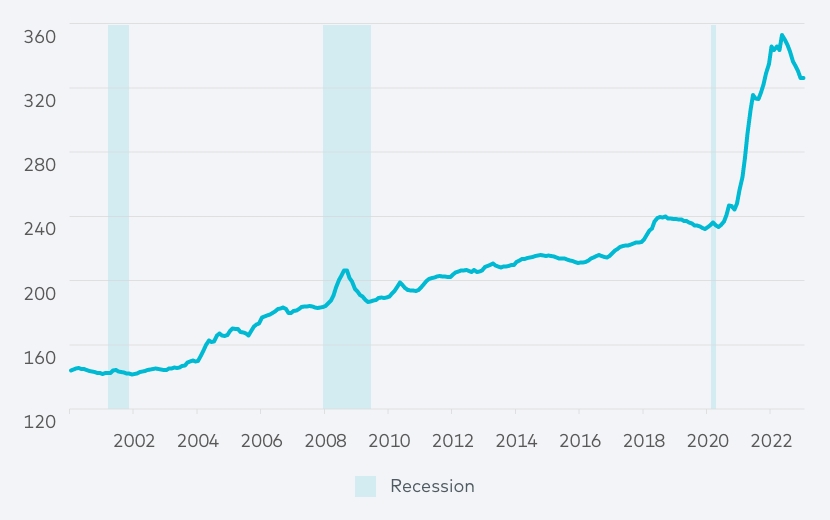
Source: U.S. Bureau of Labor Statistics via St. Louis Federal Reserve


